
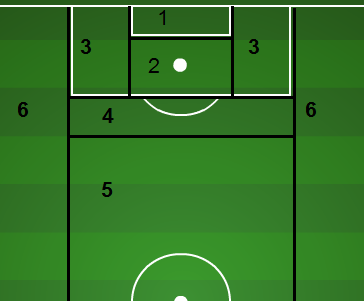
I first introduced our shot location data here, and now it will be available every week! I broke the field down into six scoring zones (shown to the right), and I tallied shot-taking data from these zones. I will post updated league rates on this page in addition to luck charts. PK attempts are included in zone 2, but own goals have been left out. I have a hunch that most teams' finishing rates will tend to regress at least partway toward to the league's average finishing rate within each zone, especially the finishing rates against. Thus the difference between goals and expected goals may imply some impending regression in the points table for some teams.
The Distribution columns (Distr) indicate the percentage of the particular events that come from the zone in question. For example, 54.9% of all goals are scored from zone 2 while only 30.7% of the attempts are taken from zone 2. It's an efficient zone, though probably not quite as efficient if I were to remove PKs.
League Data (2013)
| Locations | Goals | GoalDistr | SOGDistr | OffDistr | BlksDistr | AttDistr | Finish% |
| One | 129 | 15.7% | 7.4% | 4.6% | 2.4% | 5.0% | 31.1% |
| Two | 451 | 54.9% | 36.8% | 31.5% | 20.7% | 30.7% | 17.7% |
| Three | 100 | 12.2% | 18.4% | 15.7% | 17.1% | 16.9% | 7.1% |
| Four | 85 | 10.4% | 17.5% | 17.2% | 25.5% | 19.2% | 5.3% |
| Five | 51 | 6.2% | 18.2% | 28.8% | 33.5% | 26.4% | 2.3% |
| Six | 5 | 0.6% | 1.8% | 2.1% | 0.9% | 1.7% | 3.5% |
