Vancouver Whitecaps 2018 Season Preview

Vancouver Whitecaps 2018 Season Preview

Bucking most analytical trends, last season was an unexpected success for the Whitecaps. Beyond a new starting striker, they haven't changed much for 2018, so will hope their luck continues.

2017 in Review

My view going into the season last year was that Vancouver was not a playoff team. They surprised me and many others by finishing third in the Western Conference, only a point behind Western Conference leaders Seattle and Portland. The Whitecaps went on to beat San Jose 5-0 in the first round of playoffs, and finished the season with a disappointing conference semi-finals loss to Seattle. After they tied nil-nil at home, they went to Seattle and never looked like a threat, losing by two.

My concern for Vancouver going into last season was that after losing Pedro Morales, they didn't have anyone to maintain possession. Despite their final record, this was accurate, as Vancouver only had 39.2% possession, lowest in MLS. They also took an incredible 131 fewer shots than their opponents, a disparity better than only Colorado and Minnesota. Furthermore, their expected goal differential was -5.95, 16th in the league. Their PDO was 1089 (3rd highest in MLS), suggesting they got lucky in their offensive productivity. In sum, this team defied nearly all the analytics that tell us if a team is good or not.

Read More

Game Theory: The Seattle-Vancouver draw and who left more on the table

Game Theory: The Seattle-Vancouver draw and who left more on the table

Let’s talk nerdy for a second and look at the atrocious and visually unappealing Seattle-Vancouver 0-0 tie from the standpoint of game theory and probabilities.

On the broadcast, Sounders head coach Brian Schmetzer stressed during the pregame interview the importance of his team earning a clean sheet. That telegraphed to both viewers at home and his opponents' that he planned to take a defensive first approach on the road. Hardly a surprising move.

Likewise, Carl Robinson, the Vancouver Whitecaps head coach, made it clear through social media leading up to the match that he would be utilizing his depth given health issues for Jordy Reyna and Cristian Techera, limiting an attack that ranked 15th in total expected goals.

Read More

Vancouver Whitecaps 2017 Season Preview

Vancouver Whitecaps 2017 Season Preview

As a Canadian the struggle of the Vancouver Whitecaps is probably more personal than someone who follows MLS from elsewhere. After Toronto FC became the joke of the league mainly through the miss-management of ownership, the Whitecaps expansion to MLS was a huge hope for Canadian soccer. Because of their past NASL, CPL and USL success, as well the Vancouver region being known as a Canadian hotbed for soccer, expectations were high. Whitecaps president Bobby Lenarduzzi might also be the biggest name in Canadian Soccer for his success with a number of Vancouver soccer teams and the Canadian National Team.

Read More

2016 ASA PREVIEW: VANCOUVER WHITECAPS

On September 19th, 2015 the Vancouver Whitecaps led the race for the MLS Supporters’ Shield. From then, the team fell victim to an almost-comical trend of league leaders performing like cellar dwellers, collecting five points from their last six games and backing into the playoffs (inasmuch as a second seed can back into anything). Vancouver bowed out of the playoffs on their own turf, losing 2-0 against Portland to follow up on a scoreless draw down south, landing only 5 of 22 shots on target over the two-leg series. At their best, the Whitecaps are a dangerous counterattacking team that overwhelms opposing defenses with an athletic attacking midfield and aggressive passing (note the high total shot ratio of 0.532). At their worst, the team looks much the same… but wastes the ball with poor shot selection and lost possession (note the possession ratio at 0.469, third worst in the league).

2015 in Review

Drew’s 2015 ASA preview called attention to a young and promising attack, but raised questions concerning Vancouver’s defensive strength with a new pair of centerbacks. Ultimately, the Whitecaps defense significantly improved from 2014, ranking second in goals allowed and first in xGA, on the strength of Matias Laba, Kendall Waston, and an outstanding year from goalkeeper David Ousted. Waston and Laba together account for roughly 34-35% of the team’s defensive actions (excluding recoveries and fouls), reflecting the former’s physical dominance (particularly in the air) and the latter’s exceptional activity rate in the defensive midfield. No individual attacker stepped up as a consistent scoring threat across the full season, with streaky production from forward Octavio Rivero and midfielders Kekuta Manneh, Pedro Morales, and Christian Techera.

More on the keepers and defense after the jump.

Read More

MLS Playoff Projections

By Matthias Kullowatz (@mattyanselmo)

In preparation for the beginning of the MLS Playoffs on Wednesday, we're rolling out projections for each subsequent round. Throughout the playoffs, you can find them under the "Projections" tab in the upper right. First, let's take a look at what our simulation spit out, and then I'll explain what the simulation was thinking.

Team Quarters Semis Finals Cup Winners
NYRB 1.000 0.672 0.445 0.326
CLB 1.000 0.511 0.197 0.130
MTL 0.632 0.331 0.139 0.089
VAN 1.000 0.554 0.288 0.089
FCD 1.000 0.526 0.270 0.082
NE 0.496 0.211 0.099 0.064
TOR 0.368 0.145 0.082 0.051
LA 0.429 0.227 0.126 0.043
POR 0.591 0.257 0.117 0.039
SEA 0.571 0.242 0.106 0.033
SKC 0.409 0.195 0.092 0.028
DCU 0.504 0.130 0.037 0.026

The simulation is designed to follow the new MLS Playoffs format. Two-legged series, which occur in the conference semifinals and finals, are modeled using simulated scores from a bivariate Poisson model. This allows us to both precisely project outcomes, and to update the probabilities after game one of such a series. 50,000 iterations of the MLS Cup Playoffs are run, and the outcomes from those iterations are summarized to produce the projections you see above.

It should come as no surprise that the Red Bulls are far and away the most probable team to win the Cup. They have dominated our power rankings for weeks, and their 32.6% chances at winning the cup line up very closely with what we gave 2014's favorite LA Galaxy (33.4%) and 2013's favorite Sporting KC (30.2%). New York led the league in both actual goals scored and expected goals scored, and the model has found that goal scoring is more predictive of future success than goal allowing. This is why they have topped our power rankings for so long.

It should also come as no surprise that D.C. United received our worst probability of winning the Cup. Despite home-field advantage, DCU is only given 50.4% chances of beating New England in their play-in game. DCU's expected goal differential is bad, and their actual goal differential is surprisingly bad. They are the only playoff team with a negative xGD, and the only playoff team with a negative GD. In other words, even if you don't subscribe to how xGoals handles DCU, actual goals doesn't like them either. 

I think seeing Columbus and Montreal with the next-best chances of winning the Cup is a bit confusing at first, but it actually makes perfect sense. If either of those teams has to face NYRB, they will do so in a two-legged series where home-field advantage is largely stripped away. On the other coast, whichever Western Conference team makes the final has a good chance (44.5%) of playing in New York in that one-game championship. Essentially, when and how you play New York largely determines your probability of winning the Cup.

Speaking of home-field advantage, we account for it with two processes. First, the model knows who's playing at home, and adjusts outputs accordingly. That has been true with our Playoff Push all season. Second, the two-legged series are set up such that if teams tie on goals, and on away goals, they will play two 15-minute overtime periods followed by penalty kicks if necessary. Additionally, that will only happen on the higher seed's turf. Our simulation determines if such an aggregate-tie occurs, and then indirectly gives the home team (also the higher-seeded team) a slight advantage in extra time. We regress the home team's 90-minute probability of winning, conditional on not-tying, halfway back toward 50%. This is an approximation to what FiveThirtyEight has done with extra time, where the better teams are still given advantages in what is not a 50-50 outcome.

Anyway, enjoy the playoffs! And check back for updated projections. 

How Long Does It Take a Team to Mesh?

By Kevin Minkus (@kevinminkus)

While beginning a season 0-3-0 does not a happy fan base make, Sunday's win over Philadelphia has some Chicago Fire fans feeling at least a little better about the team's rebuilding process. Throughout the beginning of the season, coach Frank Yallop has frequently stressed that the team needs time to adjust to each other. After all, they brought in three new designated players during the off-season, and are returning players who accounted for only 63% of last year's minutes (the league average over the last four seasons is around 71%). It should take a while for all of those new pieces to mesh from the somewhat disjointed side we've seen into a coherent whole. But, given the Fire's level of roster turnover, how long should we expect the meshing process to take?

The term “meshing” is a slippery one, and can be defined in any number of ways.  Is it when a team's roster turnover no longer informs its results? Is it when a team's results sufficiently indicate its performance for the rest of the season? Is it when a team reaches the level of performance it will remain at throughout the rest of the season (if, in fact, a team can ever be expected to do so)?

Each of these definitions could be argued as valid, and I'm sure there are many other possible definitions not considered here. As it stands, though, these are the three I will analyze, using MLS data since 2011, in hopes of arriving at an answer to the question of how long it takes a team to mesh.

Let's start with the first definition- meshing defined as the number of games in which roster turnover still directly informs a team's results. 

This graph shows the correlation between points after x number of games and the percentage of a team's field minutes returned from the previous season. 

A positive correlation suggests that as roster stability increases, so does points earned. Numbers below the red line are not considered statistically different from zero (at 90% confidence). Note that the correlations in general aren't huge, but they do exist. As you can see, the correlation between roster stability and points peaks at game three, and remains statistically significant until game five (after which it remains insignificant until close to the end of the season).

A similar pattern exists if we look at defensive stability, though the correlation becomes doesn't become insignificant until after 8 games:

These two graphs, then, suggest (though perhaps not convincingly), that it may take as few as three or four games for a team in general to mesh, while it may take as many as eight for a defensive unit to come together.

Now let's take a look at the second definition- meshing defined as the point at which a team's results through some number of games “sufficiently” indicate what its results will look like for the rest of the season.

To do this, I've split teams into two groups- those with “high” roster turnover (in the top 50%), and those with “low” roster turnover (in the bottom 50%). I then regressed the team's final points total on the team's points total after x games, for each of the two groups. The Rsquared values for each of these regressions are graphed below, with the linear models from the set of all teams included as well. So essentially what we are looking at it is how well we can predict how a team will finish the season, based on what they've done after a given number of games.

Through six games, each game is about as predictive for each group, meaning that how well a team with high roster turnover does through six games is just as indicative of how that team will finish as how well a team with low roster turnover does through six games. That is to say, we don't gain any extra predictive power by knowing a team's level of roster turnover.

By game seven, though, high turnover teams begin to out-pace low turnover teams- by game seven we have a better idea of how high turnover teams will finish the season than low turnover teams. 

By game nine, the R2  value for high turnover teams is at .546, which is pretty high. We would expect predictions made using this nine game point total to be on average only about seven points off the final season total. That gets us pretty close for being barely a quarter of the way into the season.

 Though it's a normative statement not a positive one, and you could really draw the line anywhere, I would probably suggest that nine games is as good a place as any to set the limit on meshing based on our second definition. At the very least, we can say that after nine games we should have a decent idea of whether the rebuilding process will be successful in year one.

Finally, let's turn our attention to the third definition- meshing as the point at which a team reaches its consistent level of performance.

Let's investigate this phenomenon a little bit. 

Here's a graph of the three game rolling expected goal difference (at x = 4, the value on the y axis is the xGD from games two, three, and four, for example) for Sporting Kansas City last season- a decently representative mid-table team.  Expected goal differences provide a pretty reasonable statistic for gauging how good a team is.

It's pretty much all over the place. 

A three game rolling points per game graph of another mid-table team from last year, the Vancouver Whitecaps, tells a similar story:

These graphs point to something which I think is an important (though perhaps obvious) point to make; it's mostly unreasonable to expect game by game measures of a team's strength to converge over the course of a season. (Metrics like xGR (expected goal ratio), TSR (total shot ratio), and points per game will converge, but usually only when they're being calculated on aggregate.) There are a lot of reasons for this. Injuries, international call-ups, strength of schedule, and mid-season transfers are all factors which affect a team's consistency of performance. Teams, save maybe the very dominant and the very bad ones, just go through peaks and valleys throughout the year. They have good games and bad games. 

What does this mean for meshing, then?

Well, we've already seen that how a team performs at the start of the year can be predictive of where it finishes, particularly for teams with high turnover. The point above, though, suggests that how a team starts the year isn't necessarily indicative of how it will perform throughout the year. 

For teams who haven't quite come together yet, then, there is certainly still hope of righting the ship. Given the above analysis, I would expect the effects of having new players brought in to the system to begin to wear off by game four or five (though this may take a bit longer this season because of international call-ups). By game nine or ten, a team should have a decent idea of how well it has done in rebuilding its roster. If things remain bleak at that point, there is still the possibility of finding some success, but it may come only in limited doses.

ASA 2015 Season Previews. Every daNG one of them!

By Drew Olsen (@drewjolsen)

In preparation for this weekend's games (they're actually happening!), we've been writing two team previews per day for the last two weeks. Going in reverse order of 2014 finish, ASA and our (very) small band of writers have published 20 articles, covering each team's 2014 season, their offseason changes, and their prospects for 2015. If you haven't read them all yet, AND WE KNOW YOU HAVEN'T, then you can catch up here.

Eastern Conference

Chicago Fire by Mike Fotopoulos
Columbus Crew by Harrison Crow
DC United by Jared Young
Montreal Impact by Harrison Crow
New England Revolution by Drew Olsen
New York City FC by Drew Olsen
New York Red Bulls by Harrison Crow
Orlando City by Harrison Crow
Philadelphia Union by Jared Young
Toronto FC by Jason Poon

Western Conference

Colorado Rapids by Harrison Crow
FC Dallas by Jason Poon
Houston Dynamo by Harrison Crow
LA Galaxy by Sean Steffen
Portland Timbers by Drew Olsen
Real Salt Lake by Matthias Kullowatz
San Jose Earthquakes by Tom Worville
Seattle Sounders by Harrison Crow
Sporting Kansas City by Matthias Kullowatz
Vancouver Whitecaps by Drew Olsen

2015 ASA Preview: Vancouver Whitecaps

*xG = expected goals, xA = expected assists, xGD = expected goal differential. For more information see our xGoals by Team page.

By Drew Olsen (@drewjolsen)

For a team that entered 2014 with middling expectations, securing 50 points for the first time in MLS club history and making the playoffs was no small success for the Whitecaps. But this is a team that has finished with between 43 and 50 points each of the last three seasons and been eliminated twice as the 5th seed in the playoffs. Vancouver is beginning to take on the same role Costa Rica occupies in CONCACAF qualifying; both are good teams that can be counted on to pose a challenge to any opponent, but are not contenders to finish near the top of the standings.

To try to change that reputation the team is building a young, talented roster led by 2nd year coach Carl Robinson. It is a roster that is unlikely to win MLS Cup in the next season or two, but has lots of promise for the future. With eight homegrown players 22 or younger plus the addition of Young DP Octavio Rivero, the future looks bright in Vancouver.

Expectations are tempered for 2015 and it will be difficult for the Whitecaps to make the playoffs again in a competitive Western Conference, but that does not mean this season won't be a success. With an average roster age less than 24, this year is likely to be a stepping stone towards eventual success in Vancouver.

Defense

There is plenty to build on from last season, beginning with the Whitecaps' stingy defense. Allowing only 1.17 goals per game last year kept Vancouver in many games, and our expected goals metrics suggest they actually got a bit unlucky by allowing as many as they did. In other words, the quality of this defense was no fluke.

David Ousted was an exactly average keeper last year, and it's unlikely much will change for him in 2015. Jordan Harvey started every game last season, and he will again join Steven Beitashour at fullback. The question mark comes from the center of defense, where last year's starters for much of the year, Johnny Leveron and Andy O'Brien, have both moved on. If the quality on the backline of 2014 is to continue, it will have to come with a new centerback pairing. Kendall Waston looks likely to take one of the starting spots, with newcomers Pa Modou-Kah and Diego Rodriguez fighting for the other starting position. The 34 year old veteran Kah comes from Portland, where he has been in and out of the starting lineup for two seasons. Rodriguez joins from Uruguay, by way of La Liga side Malaga. It is not an understatement to say the Whitecaps' season may depend on the ability of its defense to mesh.

Midfield

Anchored by DPs Pedro Morales and the now officially signed Matias Laba, the midfield will again be one to be reckoned with. Morales' 20.75 xG + xA was 4th in the league last season, and he will continue to be relied on to create for the young attacking corps. Laba isn't afraid to get stuck in, and should provide a valuable bit of protection in front of the new centerbacks.

Russell Teibert returns on the left side after a disappointing 2014. A lot was expected from him after two goals, nine assists, and 35 key passes in 2013, but he managed no goals and just two assists and 24 key passes, despite playing 2000 more minutes last season. Erik Hurtado may end up on the right, and also might compete against the aging Mauro Rosales for playing time. Rosales started the final 10 games of the season after coming over from Chivas USA, but at age 34 he set a career high for most minutes since coming to MLS. Whitecaps mainstay Gershon Koffie will also try to regain a foothold in the midfield after missing the end of last season with injuries.

Forwards

Despite the hype surrounding young strikers Kekuta Manneh (20 years old) and former Rookie of the Year Darren Mattocks (24), scoring proved difficult last season. The 42 goals Vancouver netted were 6th worst in the league and six fewer than any other playoff team. To bolster their attack, Young DP Octavio Rivero was signed from Chile, where he scored 10 goals in only 18 appearances last season. Rivero looks ready to contribute from day one, having scored a brace in his preseason debut.

Prognosis

Vancouver has a very young team that looks to be both fun and frustrating to watch this season. While the attack has been improved, a drop-off in defensive quality is likely. It will be difficult to return to the playoffs in a loaded Western Conference, but if the defense can meld and Rivero can score, the sky is the limit.

Playoffs are a real possibility for the Whitecaps

Vancouver finished outside the playoff picture last year in a conference that allows 55.6 percent of its members to advance into November. Despite passing the "eye test" with a lot of talent, and despite producing a positive goal differential, the Whitecaps did little to convince our more advanced soccer statistics that they were a good team. Vancouver fired off 12.9 shots per game, but allowed 15.1. Furthermore, when those shots are valued based on quality, Expected Goals suggests Vancouver was below average, posting a negative xGD. Supporters may have pointed to their excellent shot accuracy and finishing rates as signs of talent and reason for optimism, but those things don't stabilize quickly, and the man who was most responsible deserted them for Liga MX. To kick off the season, we provided previews of all 19 teams. Jacob covered Vancouver, and he justifiably wrote, "As the 2014 season gets set to begin, Vancouver is one of just a few teams in the league that don’t appear to be as good as last year." Losing internationals Kenny Miller, Y.P. Lee and Camilo would probably make any MLS team worse, and before the acquisition of Matias Laba, Steve Beitashour was probably the most notable addition. On average, you readers picked the Caps to finish 7th in the West, and 76 percent of you guessed that they would miss the playoffs. I'm quite confident that I picked them to finish in 8th place. Missing the playoffs may very well still happen, but that outcome doesn't seem to have a majority of the probability anymore.

I think it's fair to say that Vancouver's 2014 has been surprising for most everybody. After ten games, nearly one-third of a season, Vancouver finds itself in third place. More importantly, it has an above-average shot attempt ratio (1.1) and positive expected goal differentials both overall (+0.13 per game) and in even gamestates (+0.36 per game). In 2013, the first 10 games of the season proved to be reasonably predictive of points earned in the final 24, as shown below.

Predictor Correlation P-value
GD 0.43 0.091
AttRatio* 0.55 0.000
xGD 0.78 0.000
xGD (zero) 0.75 0.000

A team's actual goal differential during the first 10 games had the weakest correlation to its points earned in the last 24 games, as any reader of this blog would have expected. But look at the correlations between xGD in the first 10 games and points earned in the last 24 games. Only more seasons of data will tell us if the correlation is truly that strong, but it's definitely a good indication for Vancouver. The xGD model would expect them to earn another 37 points, totaling 53 points for the season---a figure that, in combination with our playoff chances, suggests the playoffs might be more likely than not likely for the Vancouver Whitecaps.

*The correlation for Attempt Ratio was calculated from all team seasons between 2011 and 2013, while the other correlations could only be calculated from 2013 with the available data.

How it Happened: Week Ten

Another weekend, another bunch of ones and zeroes on the scoreboards for the games I checked out. The season's a quarter done now for just about every team, and reality is starting to set in that playoffs are only going to be a dream for some this year. Still, MLS is a league of incredible parity and almost everyone still harbors dreams of the postseason, no matter how realistic they are at the moment.

Portland Timbers 1 - 1 LA Galaxy

Stat that told the story for both teams: 2 goals, 1 uncalled red card on a breakaway in 2nd half stoppage time

lapor10

It's nearly impossible to analyze this game without spending a bulk of your attentions on second half stoppage time, when both goals were scored. Not only that, but LA's Juninho had a breakaway chance to put the game away and was bundled over with no foul called. All in all, it was a pretty incredible conclusion to a game that was fairly entertaining, if not particularly well-played. To some degree, it was more of the same for both teams: the Galaxy struggled to finish the chances they were able to create, and Portland looked out of sorts and a little slow compared to last year's high-octane outfit.

I want to spend a paragraph here talking a little about the apparent tactical trends of the league at the moment. For the last couple years, it seemed like the formation en vogue was the high-pressing 4-3-3: Kansas City and Portland were the most notable success stories using this setup. But this year, it appears the trend has shifted to the 4-4-2 with a diamond midfield, a la Real Salt Lake. It seems like every team in the league has at least experimented with it this year, from LA to Colorado to DC. The MLSSoccer.com March to the Match podcast did a great feature on this tactical trend a few weeks back detailing some of the pros and cons of the formation.

Anyway, this game seemed like a pretty decent case study with these two formations facing off with one another: Portland's 4-3-3 against LA's diamond midfield. It's my opinion that the narrow diamond midfield does a great job of neutralizing what made the Timbers' 4-3-3 so effective last year - that's part of why RSL just seemed to have Caleb Porter's number last year. Portland was at their best last year mainly because of two guys: Diego Chara and Will Johnson, who played as a double pivot and covered more ground than the Trans-Pacific Railroad. However, the Galaxy's narrow midfield boxes that double pivot in with four central mids who are all tucked inside, limiting the number of balls Chara & Johnson can win and thereby limiting Portland's possession. There are plenty of other reasons the Timbers haven't been great so far this year, but it's a trend worth watching as they try to turn their season around.

Columbus Crew 0 - 1 Vancouver Whitecaps

Stat that told the story for Columbus: 90.33% of minutes this season have been played by starting eleven

It's no secret that Columbus started out this season like gangbusters and have since played more like busts. The reason for this is inherently simple: they only have one way of playing. Every single game from Columbus is basically the same: they play the same guys in the same roles and try the same things. It caught teams by surprise in the first few games, but now that the opposition knows what's coming (short passes out of the back, fullbacks getting way forward, etc.) it's gotten a lot easier to beat. And now it's up to coach Gregg Berhalter to make some adjustments and at least give the Crew a plan B so this losing skid doesn't continue.

Stat that told the story for Vancouver: average age of midfield and forward: 23 years old

Vancouver has sneakily been one of the surprise stories of the 2014 MLS season. Everyone knew they had a good deal of young talent on the squad, but nobody was sure how the chemistry would work out under first-year coach Carl Robinson. So far, returns have been impressive. Not only has Robinson set the team up in a position to be successful tactically, but he's handed over a ton of responsibility to the youngsters to great effect. With veterans Kenny Miller gone and Nigel Reo-Coker perhaps on the way out, even more of the load is going to be heaped onto the 25-and-under players. During this victory, the only midfielder or forward in the starting eleven over 25 was Pedro Morales (28). And even when they made subs, they brought on 20-year-old Omar Salgado and 21-year-old Russell Teibert - I'd say the future is bright in Vancouver.

Philadelphia Union 0 - 1 DC United

Stat that told the story for DC: wide presence of the forwards

dc10


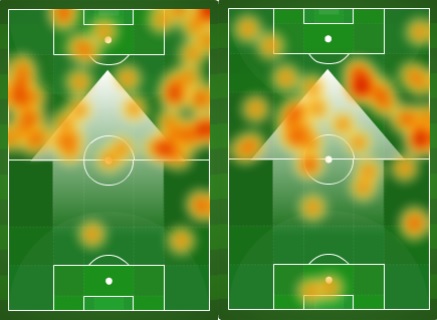
It's interesting that a lot of season previews of DC United focused on if the wide play would be good enough to get quality service for new striker Eddie Johnson. I say this because DC has been as good, if not better, as anyone could've hoped, despite the presence of roughly zero wide midfielders and zero Eddie Johnson goals. There are obviously a few reasons they've been so good, but chiefly among them is that this is Fabian Espindola's team. He's played better this season than I ever remember him looking in Salt Lake as the focal point of United's attack, orchestrating everything and creating a lot of chances. He does this by floating to the wide areas of the field to provide some width to DC's narrow formation, as his heat map above shows (EJ's actually pretty good at this too, particularly when holding the ball up).

Stat that told the story for Philadelphia: 647,428 times caught ball-watching this season*

Philadelphia was everyone's darling in the first few weeks of the season. All their new acquisitions looked really impressive, they had a young and improving defense and some talent up top that was sure to start banging in the goals soon. Fast forward a couple months, and the bottom has fallen out. This loss was their ninth game without a win, they've switched formations like four times hoping for a spark, and their coach might get fired soon. So what's wrong? Lots of things. But #1 in my book is simply that the Union didn't seem that interested in playing soccer against DC this weekend. I can't tell you how many times I've seen Philly midfielders or defenders or really anyone just watch an opposing player run by them or pass the ball by them with little to no contesting. And this isn't a problem for one or two players, it's the entire team. Sorry to be such a rah-rah coach type who says they just need to try harder, but the Union need to be more active, or engaged, or try harder....whatever wording works best.

*this is only an approximation because I couldn't find Opta's information on this