

Modeling Tactics: Finding the most proactive team in MLS
/By Jared Young (@jaredeyoung)
Last season the New York Red Bulls took the crown as the league’s most proactive team. The standing was generated by compiling two scores, one offensive and one defensive, that measure a team’s proactivity both with and without the ball. Generally teams gravitate to either a fully proactive approach, pressing high on defense and focusing on maintaining possession of the ball, or a reactive approach, sitting back on defense and taking a more direct route on offense to take advantage of the space behind the ball. Both methods can work as evidenced by league champions Barcelona and their proactive style and of course Leicester City’s reactive style. These scores are have been created with a goal of determining which teams are proactive and reactive in Major League Soccer, but could be applied to any league.
Before this season’s initial reveal, a change has been made to the offensive tactics model. More passing data was used in the process of defining whether or not a team is passing directly or indirectly. Here is a look at the profiles of the two extremes.

The statistics in the chart represent the averages of teams labeled proactive and reactive by the offensive score. Some of these metrics were used in the regression and others are just used to help highlight the difference statistically between the two approaches.
All of these passing differences make logical sense. Direct passing teams send 27% of their passes more than 25 yards and 73% of all passes are toward the goal. Indirect or proactive teams utilize shorter passes with just 15% longer than 25 yards and send more than one in three passes backwards. Direct teams are more likely to kick their ball in the air as 10% of their passes are from headers versus 7% from indirect teams. Indirect teams use crosses more frequently than direct teams too. But the statistic that truly makes it clear is distance passed up the field.
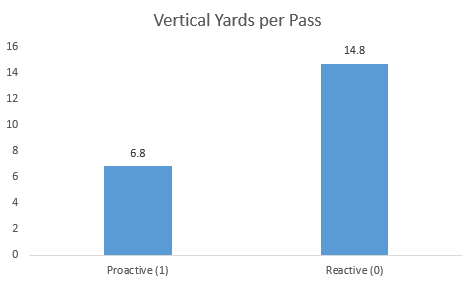
This chart shows that direct passing teams pass the ball 14.8 yards up the field, more than twice the average distance of indirect passing teams.
The defensive scoring is the same as last year, which is simply looking at passes allowed per defensive action (tackles attempted, challenges and interceptions) in their own attacking half. The analysis last year showed that most teams apply the same defensive pressure in their own defensive third and that above that line teams start to separate themselves, with statistics above the half line showing the most separation.
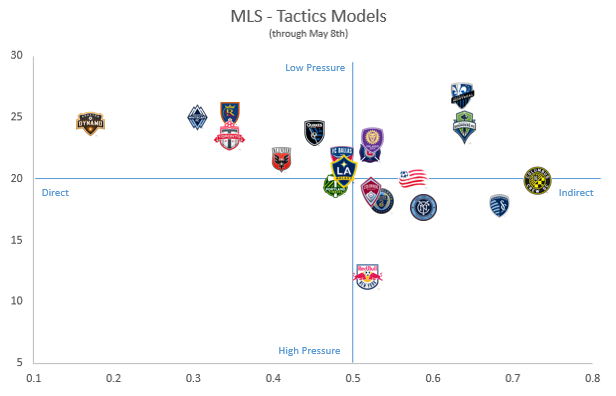
With all of that, here is how the 2016 season stacks up through May 8th.
And for reference here is the chart that ended last season.

Note: Last year's offensive score was on a scale of 0 to 10 with an average of 5 and this year it is 0 to 1 with an average of 0.5.
The new offensive score does adjust last year’s numbers for some teams but generally speaking the scores are very highly correlated. There were a few teams with notable shifts due to the score change however and those will be pointed out below. Here are a handful of observations:
- For the most part teams haven’t shifted dramatically from last season but there are some exceptions.
- Last year there were three teams that allowed fewer than 15 passes per defensive action but Sporting Kansas City and Real Salt Lake are sitting deeper this season. It appears only the New York Red Bulls are consistently pressing this season.
- That said, the Red Bulls are less proactive offensively this season, dropping back to the middle of the pack.
- Sporting Kansas City has undergone the biggest transformation this season moving from one of the most direct teams last year to the second most indirect team this season.
- Home and away differences can be dramatic – while the LA Galaxy appear to be middle of the road they are actually extremely different home and away. Their offensive score is .73 at home and .18 on the road, by far the biggest gap of any team.
- Toronto FC might be another example of that home away differential. They have been a reactive team so far this year but given they started their season on the road that makes sense. It will be interesting to see how much more proactive they become as their home schedule picks up.
- The two surprise stories this season, the Colorado Rapids and the Philadelphia Union, have both been more proactive this season, both offensively and defensively.
- No one team can claim the throne of most proactive team. The Columbus Crew, Sporting Kansas City and the New York Red Bulls are all fairly close and no team is significantly above average on offense and defense.
- The Houston Dynamo are clearly the leagues most reactive team. They were one of the teams that were more direct than last year’s score indicated so they have actually been consistently reactive year over year.
- The quadrant of high pressure and direct passing teams has been abandoned this season, whereas last year Real Salt Lake and Sporting Kansas City played there. It’s a very difficult combination to play physically as teams work hard to pressure the ball and then have the tendency to have shorter possessions. Real Salt Lake has found more success this year sitting deeper on defense.
Next month the focus will be on the difference between teams home and away and we can start to examine the success and or failure of the different approaches across the league in more detail.