

A Deep Dive Into Shot Location and Placement
/By Alex Rathke (@alexrathke)
The 2017 MLS season began with a bang over the weekend! During this time, I had a look in the archive room on shots taken (2011-2016) and thought it would be a nice time to examine shot placement in MLS. This analysis will use some of the ideas from Colin Trainor’s article from Statsbomb a couple of years ago (using one season data from Europe’s Top five leagues (2012/13), while also building upon his piece and examining shot locations and placement in further detail.
At the start of Colin’s piece, he straight out stated that one thing has to be reiterated time and time again: “you can never just take the first metric at face value as further analysis can be undertaken, and inevitably this second level of analysis can provide insights that are missed at the higher end of data review”. Now that is not to say that my piece will be anything better, that was actually Colin’s second analysis on the topic (the first you can access when you read his post above). I will try and build upon his analysis by using MLS shot data to look at more ‘specific zones’ in greater detail and how these end up in placements/areas (in the goal). Before I do that, let’s look at the placement conversion rates in MLS.
Without further ado, here’s what I did. Taking shot data from American Soccer Analysis from 2011 to the end of the previous 2016 season, I used the x y location coordinates and corresponding ‘end’ co-ordinates (where the ball landed in the goal? Was it saved by the 'keeper or did it hit post?) to analyze where shots were taken over the course of the last five seasons. Below is a breakdown:
The goal in this blog post is from the view of a striker and was broken down like this:
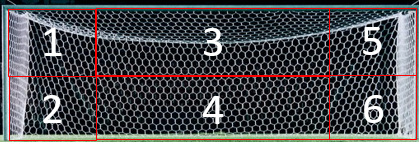
Nothing against Colin’s use of dividing the goal into 60 different boxes, I just decided it would be more beneficial for coaches and analysts to use a more simplified six box grid rather than 60. While the heat maps he had were really cool, I just found it a bit too detailed and complicated for the following reason. For example, if a shot goes top left or top right, it goes top left or top right. Personally for me, it does not need to be broken down further into a cm x cm grid.
Taking all shot on targets (with posts) from the past five seasons (2011 – 2016; footed and headers included) let’s have a look at the scoring percentage of each area.
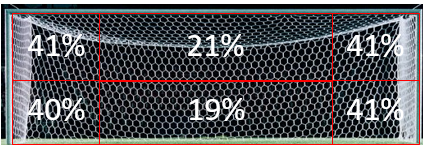
As we can see, the corners have the highest conversion rates, which may be due to a number of factors:
- The fact that the goalkeeper is often positioned (though not always) in the center of the goal.
- When the goalkeeper is standing in the center of the goal, his reach is often too short to save shots aimed for the corners.
- A keeper standing in the center of the goal, will have less reaction time to deal with the shots aimed at the corners, and therefore these have a higher chance of being converted.
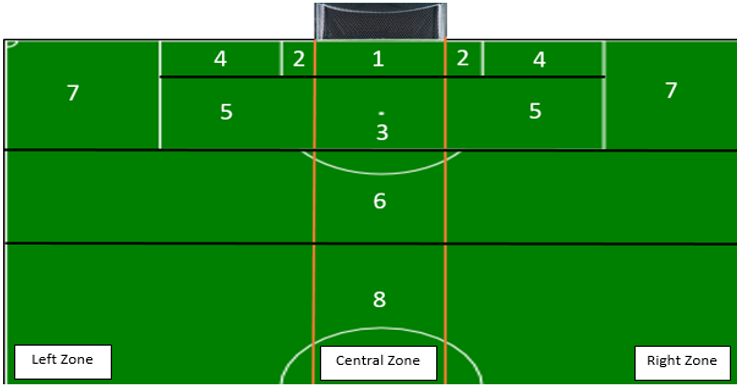
While these may be all valid reasons, they are not definite answers as to why the corners have had a higher conversion percentage than the center of the goal over the past five seasons. To look at this in more detail, I will (as Colin first did) also divide the shots into three areas: Left, Central & Right. While Colin chose to divide the shots 50% to the center and 25% (approximately) to each left and right, I will examine the center zone as in line with the two goalposts to give us a more exact central measurement. The image below shows how the three areas are broken down by using the orange lines, which cover left, central and right zones. Don’t worry about what the different numbers (1-8) mean.
Shot Placement from the Central Zone
Using the pitch image from above, let’s examine where the shots on target taken from the central zone (between the orange lines) were converted.
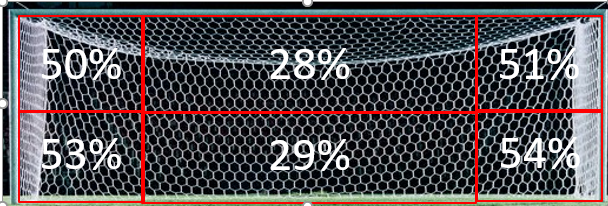
I don’t think these results would surprise anyone – it echoes the same results as the previous graph, just that the conversion percentages are higher in the corners from central shots rather than all shots on target. The central placement areas (28% & 29%) are quite high too if we consider that before they were (21% & 19%) respectively. This increase could be due to goalkeeper errors, re-bounds and possibly deflections (everything the data does not exactly tell us). I do admit that the central areas of the goal are a lot bigger than the corner areas and this can lead to some varied results.
Shot Placement from the Right Zone
How about at an angle? How are shots at an angle converted and which placement zones may or may not be superior? For the Right Zone, all shots from the right of the right post and the same for the Left Zone apply (still view of a striker). Let’s first look at the Right Zone.
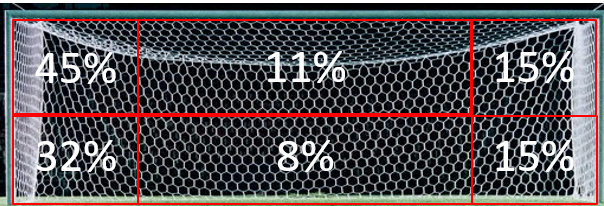
As we can see, the differences between the Far Post, Center and Near Post shot placements are quite substantial. There are a number of interesting takeaways from this grid. The first being that the grid is quite unbalanced. The conversion percentage of the far post zones (1 = 45% & 2 = 32%) are three times and double as high as the near post zones (5 = 15% & 6= 15%). The second being that while again, we do not know where the goalkeeper was positioned or what type of a shot it was, placing the ball across the face of goal and into the far corner/part of the goal reaps its benefits than the near or central areas.
Shot Placement from the Left Zone
How does the same fair across the other side of the pitch? Let’s have a look.
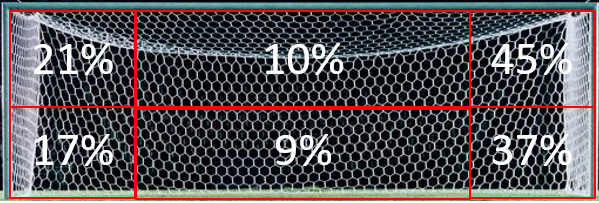
The same pattern emerges, just in reverse. Zones 5 (45%) and 6 (37%) have twice the conversion rate of Zones 1 (21%) and 2 (17%). The same discussion about goalkeeper position can also be applied here. Another thing that is interesting here is the higher conversion percentages at the near post (17 & 21%). These figures are slightly higher than their counterpart (Right Zone section above) and could be partially explained by:
- A lot of players’ right-footed shots which are taken as a possible result of cutting back in from the left.
- Possibly direct free-kicks from the left zone. A right-footed player may just want to curl the ball over the wall at the near post to score, rather than going across goal to beat the keeper.
I think it is fair to say that these results are quite important to note. Not saying that coaches and players do not know this, yet they might not be as aware of the number. It seems that shooting across the goal from tight angles (either from the Left or Right Zones) has a higher chance (two to three times higher) of conversion than going for the near post of that same area. By the way these results agree with Trainor’s article above.
If you think about it, that curling shot that bends away from the keeper and lands across goal, is a classic example. I mean how many times have we seen a player like Arjen Robben do that in his career? I have already mentioned that placing shots towards the far post at an angle can reap benefits of double or triple the conversion rate than versus the near post. Though why may that be?
I think it may primarily be down to the angle that presents itself in the ‘heat of the moment’ before a shot is taken. If you are running towards the goal from a small angle from either zone (Left/Right) into the 18-yard box, the goalkeeper will no doubt be coming out to try and pressure you and thereby reduce the angle of the near post. This leaves quite a substantial angle open to place the ball into the far corner (unless you round the keeper). Now none of this is conclusive on any front, just an explanation of what the data could be telling us. This is where video is essential to help coaches and analysts understand what happened in the ‘heat of the moment’.
If the above passage does not make sense to you, then hopefully this video will help explain it. The video shows an example where because of the angle presented to New York Red Bulls forward Bradley Wright-Phillips, he chose to place the ball into the far corner. This goal was scored from the 2016 MLS season.
These reasons outline why video is needed to further examine what the player does in situations, regarding facing pressure, decision-making and so forth.
One thing, I’d like to reiterate is that the data cannot tell us a couple of things, mainly:
- How many defenders were in the way of a shot?
- Where the goalkeeper was standing at the time (just before the shot was taken) or
- Did the shooter aim for that side specifically, because he knew the keeper had a weaker side or more specifically a weaker areas on that side?
- The previous event type (pass, flick-on etc) that may impact the choice of shot taken and thus the area it is aimed at.
In my next blog post on this topic, I want to examine if different zones on a pitch have better conversion rates in each placement area.