

MLS PScore Update: Why tactics should be tied to a team's budget
/By Jared Young (@jaredeyoung)
Those of you that have been hanging around American Soccer Analysis for a while might recall a metric that measures a team’s tactical proactivity. Despite efforts to come up with something catchier, it’s been dubbed “PScore”, and the goal is to develop a simple way to examine the aggressiveness of teams from both an offensive and defensive point of view. In essence it separates the bunker and counter teams from the Liverpool-esque possession oriented teams, and also calls out the teams with no discernible identity.
PScore has undergone many tweaks over the years but now it’s been scored consistently for MLS covering the last three seasons. The following is a look at how the league is shifting tactically at a macro level, how tactics and finances intersect, and also how specific teams have been evolving over the years.
Offense
Starting with the offensive end is a model that scores passing types to determine if a team is making an effort to control possession or play a direct style. The score is between 0 and 1, with 0 being completely direct and 1 representing short, high probability passes.
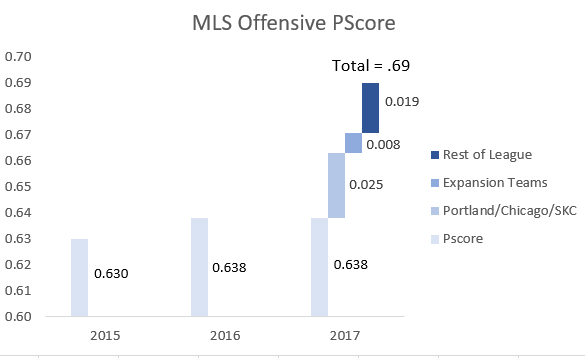
Above is a chart of the league wide offensive PScore from 2015 to 2017. What stands out is the fairly large increase in 2017 to .690, from .638 in in 2016. That means the league as a whole became more possession focused with their passing. The two expansion teams were more proactive than average and that accounted for .008 of the increase. Three teams in particular also became more notably possession oriented – Portland, Chicago and Sporting Kansas City, and they accounted for 48 percent of the increase. But the other 17 teams also netted a more possession oriented result. Could this be the impact of TAM and ultimately the influx of new talent from outside leagues?
What is also interesting is that teams are more tactically diverse offensively, something we’d expect as the clubs with more resources begin to have a systematic advantage in the league.

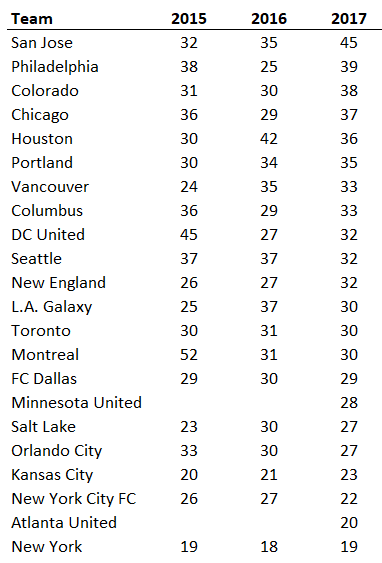
The standard deviation of PScore across the league has increased year over year. In fact, 2017 resulted in both the highest and lowest team PScore across all three seasons. Sporting Kansas City was the most possession oriented team in 2017, and over the course of the past three years, and the Vancouver Whitecaps were the most direct team.

Teams are sorted by 2017 PScore
Notice how some teams like Sporting Kansas City, San Jose, and FC Dallas have gotten more proactive over the years while teams like the Red Bulls and Orlando City have gotten increasingly direct. To illustrate what exactly PScore is highlighting in terms of style, here are the passing statistics of both Kansas City and Vancouver, the extreme ends of the spectrum.

Sporting Kansas City and Vancouver in almost every case represent the outer bounds of the league for these statistics. First notice that Sporting Kansas City completed a league high 82 percent of their passes while Vancouver completed a league low 72 percent. The American Soccer Analysis expected passing model shows that Sporting Kansas City were expected to complete 81 percent of their passes while Vancouver was expected to complete 73 percent, indicating that Sporting Kansas City made significantly safer passes, presumably in an effort to maintain possession while Vancouver attempted the most difficult passes.
That becomes more evident examining the next three variables on the chart. Vancouver sent 22 percent of their passes more than 25 yards while Sporting KC sent just 15 percent, and a remarkable one in twelve passes were off the heads of Vancouver players while one in eighteen was the rate for Sporting KC. But perhaps the biggest gap shows up in the directness of the average pass for each team. Vancouver’s average pass covered 8.7 percent of the field in the direction of their target goal, while Sporting KC’s balls traveled just 5 percent of the field. Doing that math on fields that are generally between 115 and 120 yards long, the result is that the average Vancouver pass was roughly 13 feet further up than pitch than a Sporting KC pass. My goodness. Hopefully that gives you a sense of the stylistic differences PScore is identifying.
Defense
The metric used to evaluate the proactivity of defenses is passes allowed per defensive action in the attacking half of the pitch. The higher the number the lower the pressure, and the lower the number the higher the pressure. Here is a look at the league wide trend the past three seasons.

On the topic of defense the league has seen little change. The average passes per defensive action in the attacking half has been the same and the league hasn’t differentiated much. Here’s a look at the PPDA by team.
Average passes allowed per defensive action per game sorted by 2017 results from least aggressive to most aggressive
One quick note about this metric, and that is that due to the fact that defensive actions can sometimes be close to zero for a given game, some very high PPDA metrics can result. This creates a distribution of results that is right skewed. Another option would be to look at median values for PPDA. In that case the teams shuffle around a bit, but not significantly. The average still rank orders the defensive aggression of the teams. The New York Red Bulls have led the league in attacking half pressure the last three seasons. It’s interesting then that offensively they’ve become more direct.
Combined PScore Index
The next table puts it all together with an indexed summation of proactivity. The higher the number the more proactive the team in total. The lower the number, the more reactive the team.
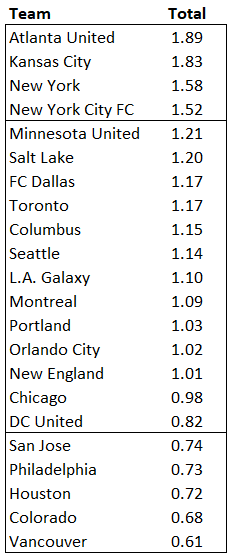
Atlanta United claimed the top spot for most proactive team, which will surprise close to no one. Meanwhile Vancouver was the most reactive. Toronto FC, the GOAT, is roughly in the middle, which may surprise some.
Somewhat arbitrarily placed are boxes around the teams. The top box represents index values above 1.25 and the bottom box represents index values below .75. The middle box is everyone in the middle. Here are the 2017 results for those three segments of teams.

The first two columns examine average goal difference and average points of the three segments. As you can see the four most proactive teams were far better than the rest of the league, and keep in mind that Toronto FC is in the middle segment. The third column is the average team salary by segment. The notable observation here is that the most reactive teams clearly spend less than the rest of the league.
The next column calculates points per million in salary. This is honestly not a great metric but it quickly highlights that the most reactive teams do pretty well when adjusting for their salary. However, Toronto FC is problematic. Their team salary at $22 million is so high that they drag down the points per million of the middle segment. Removing TFC brings the points per million up to 4.7, still well below the proactive and reactive teams.
A better method is the find a line of best fit for salary and points scored and then observe how much better the segments did against that expectation. The result of that effort is the last column which is points in the table less expected points as a function of salary. Here you can see that the reactive teams outperformed their salary level by 6.6 points, much better than the middle clubs. Proactive teams also outperform their salary by over 3 points. Even with this method TFC is problematic given they are a salary outlier. that will always under achieve from a points perspective. In this case removing the GOAT brings that last metric up to 1.3, still below the other segments.
What are the lessons here? Spend money if you can, but if you can’t it benefits a team to play more reactive soccer. If you have the money and talent then proactive soccer is preferable. But whatever you do, if you can’t outspend the league like TFC, then don’t be stuck in the tactical middle. A quick glance over to more developed leagues like the Premier League bears this observation out as well. Leicester City in 2015/16 were a committed reactive team, and Burnley is executing that style to perfection this season and performing well above their wage bill. And of course there is always Atletico Madrid, hanging in there with the big boys of Spain despite a fraction of the wages.
As MLS continues to develop and improve fans should expect to see more tactical diversity among the clubs. The Haves will push to proactive soccer while the Have Nots will commit to reactive. Fans might wrestle with this issue because reactive soccer is considered less appealing to watch, with low percentage passing and less aggressive defense. American Soccer Analysis will continue to publish PScores for the 2018 season. It will be interesting to track how the league develops this season.