

Expected Possession Goals: The Value of a Possession and Comparing xPG to Other Metrics
/July 11, 2018
Jamon Moore (@Jmoorequakes)
The How and Why of Expected Possession Goals (xPG)
It is probably easier to identify good possession by sight rather than a textbook definition: decisive movement and accurate passing lead to good looks, so I’ve been very interested in whether a metric like xG could quantify the value of a possession. If you have not already read it, please begin with Cheuk Hei’s Expected Possession Goals article . Expected Possession Goals (xPG) attempts to create a more holistic view of a soccer match by focusing on possessions rather than just shots. Possessions occur at about a 10-to-1 ratio to shots, so they can provide 10x the data for analyzing the flow of a game. Take into account just the average number of passes in a possession, and you get around 3x more data.
For xPG, xG values are assigned using the 18 zones of the soccer pitch and adding 9 sub-zones in each for a total of 162 sub-zones.
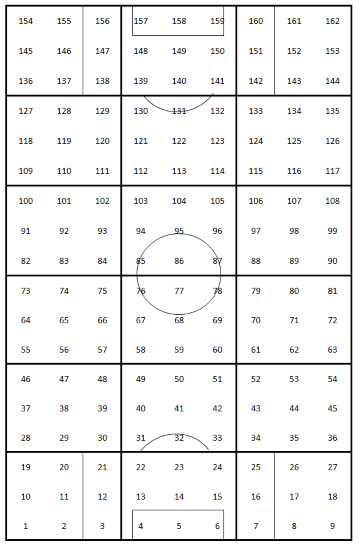
The attacking direction is from bottom to top. The average shot xG in any of those sub-zones is used whenever a successful action such as a pass, dribble or shot is completed. By adding up the xG of these successful actions, the possession xG (xPG value) is arrived at. Each player who contributes to possession with a successful action receives the xG of their action based on which of the 162 sub-zones the action took place. Many zones have no xG, and this is fine because if you just knock the ball around the back, you should get nothing. xG only starts to appear as ball gets closer to the goal. There are two elements of xPG, which is a player’s contribution to the team’s xPG and the average xPG per min a player generates when he is on the pitch.
In general, here are the steps to calculate xPG:
- Find all the possessions in a match.
- For each successful action in a possession, such as a pass, dribble or shot, calculate the xG based on the action coordinates, as if a shot had occurred.
- Assign the xG value to both the player performing the action and their team total for the match.
- Note actual minutes played for each player, including substitutions on and off.
- Calculate player possession xG contribution for the minutes they were on the pitch and divide their total possession xG created by their minutes played. Multiply by 96 to get xPG/96.
We’ll take a closer look at xG values for the 162 zones a little later.
How Does xPG Compare With Other xG-based Metrics?
It is best to understand xPG as a conceptual metric which provides more even distribution of xG across a team, including better coverage for defensive players, if not yet goalkeepers.
Expected Possession Goals (xPG) is the result of numerous discussions with and labor from Cheuk Hei, and he graciously provided me with his results for my own analysis. Ever since Cheuk Hei and I wrote about MLS defenses and pressure (see Where the Ball Was Won and Pressing, Defensive Lines, and What Defensive Actions Correlate with Goals), the pursuit has been on for a metric which could address the question: what is the value of a possession within a match?
I see a lot of similarities between xPG and Expected Goal Chains (xGC) and Expected Goals Buildup Chain (xBuildup GC or just xB). If you are unfamiliar with these concepts, read this post by Kevin Shank, which explains xGC, and also view the current season metrics for both xG Chain and xB on this page. xB is the same as xGC, except that the shooter and owner of the key pass do not receive the xG value. In this case, xB gives xG value credit to everyone else involved in the buildup, and you can find out who is contributing to goal and shot buildup but just not receiving credit for the shot/goal or key pass/assist -- the unsung heroes, if you were. Expected Assists (xA) is a metric which gives the xG value to the owner of the key pass for any shot. These are fine-grained details which may be well known to some ASA readers, but this foundation helps us examine what xPG is and what it is not.
In xPG, xG value is given to any player with a completed action within each possession. This is unlike xGC or xB, where players who are part of the possession chain are given the shot xG. In xPG, they are given xG for each successfully completed action whether a pass, dribble or shot. So xPG is most like xGC since value is given to the key pass and shot. However xGC only applies to those possessions which end in a shot and ignores every other possession. So xGC is an even distribution of xG and xPG is weighted distribution of xG. The following diagram shows where xPG and xGC compare in MLS 2018 on a per-96-minutes basis by players averages within each type of position.

As you can see, xGC is weighted to attacking midfielders, strikers, other forwards (usually 4-3-3 wingers), substitutes and outside midfielders. Substituted players are not assigned a position in the ASA dataset, but they are generally attacking players so this high average is not surprising.
When comparing xPG/96 to xGC/96, we see some similarities but also key differences: attacking midfielders and other forwards remain strong, but strikers are below average because many do not contribute consistently to the buildup phase of play. Central midfielders, defensive midfielders and outside midfielders are all above the average. Substitutes have the least impact, while defensive players remain about the same.
Most importantly, as explained by Cheuk Hei, xPG contribution shows a player’s value within a team or even within a particular formation and could even be used to evaluate role differences within a formation, such as a 4-4-2 diamond vs. a 4-4-2 flat -- or various central midfielder configurations in a 4-3-3. It becomes dangerous to draw comparisons at a player level, since a higher contribution does not compare across teams. You can’t say that Miguel Almirón on Atlanta United is “better” than Graham Zusi on Sporting KC or Maxi Morales on NYCFC because of Almirón’s higher contribution value. What matters in xPG is how important a particular player is in leveraging higher value situations within their own team.
This means xPG can be a key metric in figuring out who benefits from a team’s formational change. xPG allows us to identify the player that contributes to his team’s buildup more in a 4-4-2 than he does in a 3-5-2, for example, or that forwards are more engaged in their team’s buildup in a 4-2-3-1 than in a 4-3-3.
Evaluating Players in Expected Possession Goals
Here are the players which contribute the most to their team’s buildup according to xPG through the first 18 games of the MLS 2018 season:

If a team has fewer, shorter, or lower value possessions this will impact how much xPG it generates in a particular game or over time. One way to check this is to contrast contribution % with xPG/min.
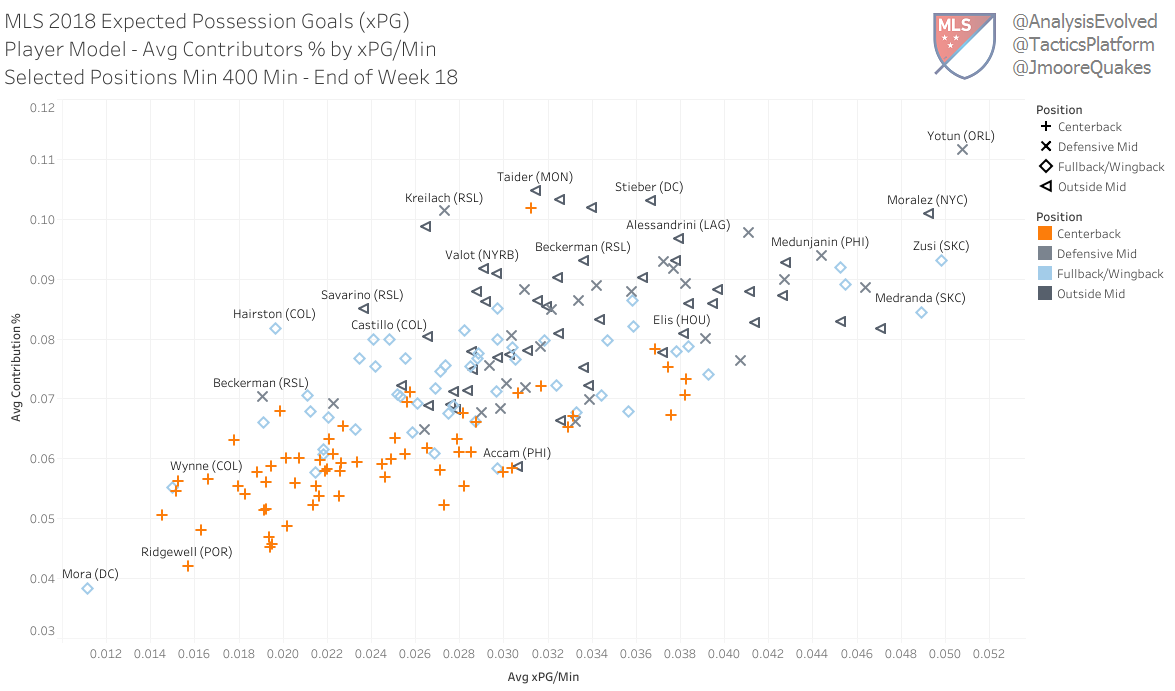
Let’s use Kyle Beckerman as an example here. He shows up on this graph twice because he has at least 400 minutes and has played both as a defensive midfielder in a 4-4-2 and on the left side of a 4-3-3 this season. He has had a 2.4% higher contribution in the 4-3-3 and has generated 0.15 xPG/min more than he has in the 4-4-2. This type of information could be very useful to Real Salt Lake’s coaching staff. If you would like to view the interactive version of this graph to find your favorite defensive player, go to https://public.tableau.com/profile/jamon.moore#!/vizhome/xPossessionGoal/DefxPGMinxContrib and hover over any symbol to see the associated player.
Average contributions are a good way to see how players are fitting in a particular formation or how that new DP signed in the summer transfer window is changing the shape of the team. To see the contribution for any particular game from this season through Week 18, I came up with this box-and-whisker visualization.

The fully interactive version that lets you explore your favorite or hated MLS team can be found here: https://public.tableau.com/profile/jamon.moore#!/vizhome/xPossessionGoal/B-and-WAllPlayersTeams
Evaluating Expected Possession Goals as a Metric
I do want to point out some of the concerns with xPG, which I believe require critical analysis from the community. Assigning xG for every completed action is a good way to acknowledge soccer as an 11-player team sport, but with weighting on some actions over others based on their potential value. But I would say it also has its own issues. Take a look at this version of the 162 sub-zones chart with the average shot xG in MLS from 2015 to 2018 in each zone. Corners have been excluded from the analysis, but Cheuk Hei has included xG for headed balls, penalties and freekicks for reasons he may choose to elaborate on.

Remember the attacking direction is up the field. There are three potential issues I see with these xG values:
There are several sub-zones noted in red where there have been no successful shots (or perhaps no shots at all). That means there are a few key sub-zones around the center of the pitch where it feels there should be an xG value, but there is not. Currently any xPG actions in those sub-zones would get a xPG value of 0. In some cases, there is a value on the equivalent sub-zones on the opposite side of the pitch.
There are several sub-zones noted in orange where the values feel questionable, and the values likely are due to a very small volume of shots, potentially more successful shots than there reasonably should be were the volume higher. In a few cases there is a distinct difference between one sub-zone and its equivalent sub-zone on the other side of the pitch. I’m not expecting exact equivalence, because, historically speaking, there are reasons for equivalent left/right areas of the pitch to have different xG values, whether it be player footedness or other factors.
I would like to see a more direct correlation with the mostly-accepted xGC and xB metrics. This would allow for analysis at a directly comparable level. For example, xPG includes possessions ending in a penalty kick, and includes successful dribbles as completed actions receiving xG. ASA’s xGC and xB use neither, and their values follow OPTA rules for defining possessions and chains: https://www.optasportspro.com/en/about/optapro-blog/posts/2016/blog-introducing-a-possessions-framework/. It would be best for critical comparison if xPG did as well, in my opinion.
One answer may be to run shot simulations with certain parameters to essentially generate missing xG data to determine the appropriate values in underpopulated zones. Or maybe David Bingham needs to do some of these shots in league games to generate some xG:

Conclusion
All in all, Expected Possession Goals is a promising conceptual metric for analyzing matches and teams based on the quality of their possessions. Cheuk Hei has provided a lot of immediate uses for the data in his initial article, and I believe the possibilities are even deeper than these articles have covered. We look forward to critical analysis of the methodology and input from the community as many of us seek to provide a more holistic view of the sequential events of a soccer match than xG and its existing derivative metrics are able to give us.