PWP: Chicago lights up New York while Montreal feels the Impact of Sporting KC

As noted in my headline, the Chicago Fire simply lit the fireworks with the youngster Harry Shipp leading the way; good for him and well done, son!  As for the new leader in Montreal--and ex-Fire coach--things weren't quite as rosy. You'll recall early last week I published this article on MLS Coaches - showing statistics, not pure speculation, on which coaches have teams that aren't performing to standard in MLS at this time.  Frank Klopas was one of those Head Coaches mentioned, and sadly his team was the only team in the bottom four of that list who didn't win this past weekend.

Mark Watson did with San Jose, Frank Yallop did in the obvious thriller in New York, and Wilmer Cabrera saw his Goats absolutely stun Colorado.  Sooner or later the wheat will separate from the chaff.

But back to Chicago.  They didn't take the PWP Attacking Team of the week by much; Sporting KC was a close second while Cabrera and the Goats were 3rd best and New England rounded out the top 4 with that blowout against Seattle.

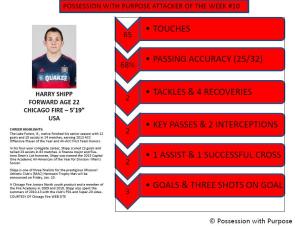
PWP Attacking Player of Week #10 - Harry Shipp - surprised?  Not likely, for only the second time this year my PWP Attacking Player of the Week was the same as the MLS Player of the Week... as odd as it may sound I take pride in my PWP Players of the Week not matching those from MLSSoccer.com.

PWP ATTACKING PLAYER OF WEEK 10

A busy day for the young lad, and almost too much information to go into my standard PWP Player of the Week.

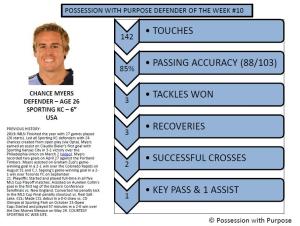
That said Sporting KC got back on track with another smashing win against Montreal.  And while they scored three goals what stood out most was their smothering defense; a leader in helping that effort was my PWP Defending Player of the Week; Chance Myers.

PWP DEFENDING PLAYER OF WEEK 10

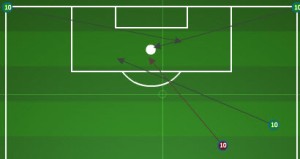
Duly noted that some players had some superb passing statistics in this game; here's a diagram of all the successful passes for Sporting against a hapless Montreal side... and even more intriguing is this diagram (also from the OPTA Chalkboard) of all the unsuccessful passes by Sporting.  WOW!  Not sure I've ever seen so sparse a chalkboard as that for unsuccessful passes!

In looking at the defensive side of the pitch Montreal offered up 45 total passes in the Sporting defending third - of which nine were throw-ins... in the area here (just atop the 18 yard box) Montreal had 5 unsuccessful passes and 3 successful passes with two of those successful passes being throw-ins.

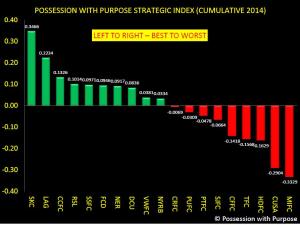
Moving on... So this week who's top and who's not in Possession with Purpose after 10 full weeks of play in MLS?

PWP COMPOSITE INDEX THROUGH WEEK 10

As a reminder, the top five Western Conference teams in the End-of-Season PWP Composite Index were the top five Western Conference teams to make the Playoffs.  In addition, the top five Eastern Conference Teams in the same Index were the top five Eastern Conference teams to make the Playoffs.

Last year's Champion has finally reached the top spot; will they be able to hold on?  I don't know, but still-unbeaten Real Salt Lake has shifted from 7th to 4th this week.

Columbus is starting their painful drop while Seattle, LA, and FC Dallas hover, and New England continues to push higher.

What is unique about this Index is it's not influenced by the "next bright and shiny object" syndrome.  Teams will fade and teams will push higher, but not on a whim; I hate whims...

With respect to the bottom teams in this Index - there is no question that the worst performing team in MLS is Montreal.  I'm not sure how anyone can consider their pathetic team output - across all categories measured - anything other than worst.  

Chivas got a notable win, but one win does not a streak make - falling a bit further this week was Toronto - moving from 6th worst to 4th worst.  Are some other teams in MLS catching on to that 'mistake driven' football that Nelson might be working towards?

Hard to say, but with some MLS stars moving off to prepare for the World Cup, there will definitely be important lineup change, and possible some big changes to this Index in the next six weeks.

In closing:

Another busy week coming with the Canada Cup Championship plus two more games for Sporting and Philadelphia.

Two diagrams for your consideration:

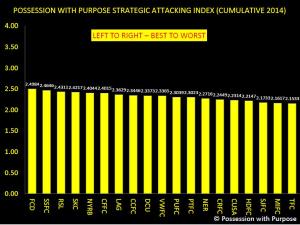
PWP ATTACKING INDEX THROUGH WEEK 10

This is the Cumulative PWP Attacking Index after week 10.

Note that the separation between the top attacking team (FC Dallas) and the 10th best attacking team (Vancouver) is 2.4984 - 2.3365 = .1619.  So when you see the overall Composite Index there really isn't that much that separates the tenth place attacking team from the 1st place attacking team...

However, small movement is still expected given that a number of teams will be without some key players for at least 5 weeks - we can hope for more for the USMNT's sake.

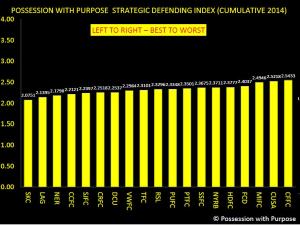
PWP DEFENDING INDEX THROUGH WEEK 10

This information reflects how well the combined opponents of these teams performs in the Defending PWP.

In looking at the diagram what the last place team offers is that the opponents of Chicago Fire, by and large, possess the ball, pass the ball, penetrate with the ball, take shots with the ball, and score with the ball more than Chicago does... if that trend continues it is likely that Chicago will have a very poor record by the end of the season.

In considering Philadelphia for a minute - they are in the bottom half but they are not being dominated by their opponents - sometimes games won and lost or drawn end up being more about a single mistake or... multiple mistakes as opposed to poor team performance.  It's data like this that tells me, as an analyst, that Hackworth has a reasonable system and plan - its' just not working because something on the pitch is broken.

I think many would offer that is the same case for Portland this year - most know that 5 points were lost due to PK's early this year, and perhaps three points were lost this past Sunday when some players simply forgot that they were soccer players and instead decided to be ball watchers...

All for now, Chris

Passing: An oddity in how it's measured in Soccer (Part II)

If you read my initial article on "Passing - An oddity in how it's measured in Soccer Part I"; I hope you find this article of value as well as the onion gets peeled back a bit further  to focus on Crosses. To begin please consider the different definitions of passing identified in Part I and then take some time to review these two additional articles (Football Basics - Crossing) & (Football Basics - The Passing Checklist) published by Leo Chan - Football Performance Analysis, adding context to two books written by Charles Hughes in 1987 (Soccer Tactics and Skills) and 1990 (The Winning Formula).   My thanks to Sean McAuley, Assistant Head Coach for the Portland Timbers, for providing these insightful references.

In asking John Galas, Head Coach of newly formed Lane United FC in Eugene, Oregon here's what he had to offer:

"If a cross isn’t a pass, should we omit any long ball passing stats? To suggest a cross is not a pass [is] ridiculous, it is without a doubt a pass, successful or not - just ask Manchester United, they ‘passed’ the ball a record 81 times from the flank against Fulham a few weeks back.”

In asking Jamie Clark, Head Coach for Soccer at the University of Washington these were his thoughts...

"It's criminal that crosses aren't considered passing statistically speaking. Any coach or player knows the art and skill of passing and realizes the importance of crossing as it's often the final pass leading to a goal. If anything, successful passes should count and unsuccessful shouldn't as it's more like a shot in many ways that has, I'm guessing, little chance of being successful statistically speaking yet necessary and incredibly important."

Once you've taken the time to read through those articles, and mulled over the additional thoughts from John Galas and Jamie Clark, consider this table.

 Stat Golazo/MLS STATS Squawka Whoscored MLS Chalkboard My approach Different (Yes/No)?
Total Passes 369 356 412  309+125 = 434 309+125+9=443 Yes
Total Successful Passes 277 270 305 309 309 + 9 = 318 Yes
Passing Accuracy 75% 76% 74% NOT OFFERED 71.78% Yes
Possession Percentage 55.30% 53% 55% NOT OFFERED 55.93% Yes
Final Third Passes 141 NOT OFFERED NOT OFFERED FILTER TO CREATE 140 Yes
Final Third Passing Accuracy 89/141= 63.12% NOT OFFERED NOT OFFERED FILTER TO CREATE 92/140 = 65.71% Yes
Total Crosses 35  vs 26 (MLS Stats) NOT OFFERED 35 35 35 No
Successful Crosses 35*.257=9 NOT OFFERED 9 9 9 No
KEY PASSES NOT OFFERED 7 9 6 6 Yes
 

* NOTE: MLS Chalkboard includes unsuccessful crosses as part of their unsuccessful passes total but does not include successful crosses as part of their total successful passes; it must be done manually.

For many, these differences might not mean very much but if looking for correlations and considering R-squared values that go to four significant digits these variations in datum might present an issue.

I don't track individual players but Harrison and  Matthias do, as does Colin Trainor, who offered up a great comment in the Part I series that may help others figure out where good individual data sources might come from.

What's next?

My intent here is not to simply offer up a problem without a solution; I have a few thoughts on a way forward but before getting there I wanted to offer up what OPTA responded with first:

I (OPTA representative) have has (had) a word with our editorial team who handle the different variables that we collect. There is no overlay from crosses to passes as you mentions, they are completely different data variables. This is a decision made as it fits in with the football industry more. Crosses are discussed and analysed as separate to passes in this sense. We have 16 different types of passes on our F24 feed in addition to the cross variable.

So OPTA doesn't consider a cross a pass - they consider it a 'variable'?!?

Well I agree that it is a variable as well and can (and should) be tracked separately for other reasons; but for me it's subservient to a pass first and therefore should be counted in the overall passing category that directly influences a teams' percentage of possession.  Put another way; it's a cross - but first and foremost it's a pass.

(Perhaps?) OPTA (PERFORM GROUP now) and others in the soccer statistics industry may reconsider how they track passes?

I am also hopeful that OPTA might create a 'hot button' on the MLS Chalkboard that allows analysts the ability to filter the final third consistently, from game to game to game, as an improvement over the already useful 'filter cross-hairs'...

In closing...

My intent is not to call out any statistical organizations but to offer up for others, who have a passion for soccer analyses, that there are differences in how some statistics can be presented, interpreted and offered up for consideration.  In my own Possession with Purpose analysis every ball movement from one player to another is considered in calculating team passing data.

Perhaps this comparison is misplaced, but would we expect the NFL to call a 'screen pass' a non-pass and a variation of a pass that isn't counted in the overall totals for a Team and Quarterback's completion rating?

Here's a great exampleon how Possession Percentage is being interpreted that might indicate a trend.

Ben has done some great research and sourced MLS Stats (as appropriate) in providing his data - he's also offered up that calculating possession is an issue in the analytical field of soccer as well.

In peeling back the data provided by MLS Stats he is absolutely correct that the trend is what it is... When adding crosses and other passing activities excluded by MLS Stats the picture is quite different and lends credence to what Bradley offers.

For example--when adding crosses and other passing activities not included by MLS Stats--the possession percentages for teams change, and the R-squared between points in the league table comes out as 0.353, with only 7 of 8 possession-based teams making the playoffs. New York, with most points, New England and Colorado all had possession percentages last year that fell below 50%, and only one team in MLS last year that didn't make the playoffs finished with the worst record (16 points) DC United.

For me, that was superb research - a great conclusion that was statistically supported. Yet, when viewed with a different lens on what events are counted as passes, the results are completely different.

All the best,

Chris

You can follow me on twitter @chrisgluckpwp


Passing: An oddity in how it's measured in Soccer (Part I)

In my passion to better understand how soccer is statistically tracked I've come across what I would call is an oddity about the general characterization of "passing" in the world’s greatest sport. Here's the deal - go to Squawka.com, whoscored.com, reference the "Stats" tab on mlssoccer.com, or review Golazo information, and you'll notice they all provide passing information.

My intent is not to dig deep into passing details – not yet, anyway. We’ll get there in another article to follow after I get permission from OPTA to reference their F-24 definitions within their Appendices. For now here's a simple question I have as a statistical person working on soccer analysis.

What is the number of passes I should use for teams and which denominator is the right number for total passes by both teams to help determine possession percentages?

In the MLS Chalkboard you can clearly see and count passes - here's an example from a game this past week.

An important filter to note - the major term 'Distribution' is not to be clicked in creating this filter - all that is clicked is 'successful pass and unsuccessful pass'; note also that some details are provided on the types of passes  - we’ll get there in another article.

Bottom line is that the MLS Chalkboard identifies 309 successful passes and 125 unsuccessful passes for a total of 434 passes attempted.

On the MLS Stat sheet - one tab over but linked here the number of passes for Chivas = 369; that number doesn't match the Chalkboard in either total, unsuccessful or successful.

For Golazo, for that same game here's their total: 369 Passes total with 75% accuracy meaning the total successful passes was 277 and unsuccessful passes totaled 92.  Not the same either.

For Squawka.com here's their total: Successful = 270 /// headers (8), throughballs (2), passes (239), long balls (21) and supposedly crosses (0) Unsuccessful = 86 /// passes (52), headers (14), long balls (20), no unsuccessful crosses or throughballs logged here?! Yet the MLS chalkboard indicates 26 unsuccessful crosses! All told that is 356 passes; those figures don't match the other data sources.

For whoscored.com here's their total: Short ball = 323, Long ball = 52, Through ball = 2, Cross = 35, for a total of 412 passes - again that figure doesn't match the other data sources.

So what's the right total?  Here’s a table to compare showing the source of data and the total passes submitted for statistical folks like us to leverage in our analysis.

MLS Chalkboard 434
MLS Statistics 369
Golazo (same as MLS Stats) 369
Squawka 356
Whoscored 412

Observations:

I have no idea what 'right' looks like here but here's what I've done to work through this issue.

I chose one source, the MLS Chalkboard, to gather and analyze statistics on passing and possession and all other things available from that data source - where other information is not offered there I reference the MLS Stats tab and Formation tab.

Why did I choose the Chalkboard?  Because it provides additional detail that shows more clarity on all the other types of passes that occur in a game.

For example; if you scroll down on the Chalkboard link and select Set-Pieces you’ll see that Throw-ins are included in the successful passing totals – by definition a Throw-in is a pass as it travels from one player to another.

So my recommendation, if interested, is to track Major League Soccer statistics using the MLS Chalkboard first - it's harder but seems to be the best one at this time.

I'm not sure why the MLS Chalkboard, Golazo, Whoscored and Squawka all had different team passing statistics; given that it is likely they all have different individual player statistics as well... but in asking a representative from OPTA about that - their response was provided below:

“The difference between the different websites could be down to a few things. Either they take different levels of data from us, or they take the same feed but only use a chosen set of information from each feed to display their own take on each game.”

By the way – I did try to find a reasonable definition of what a pass is defined as for soccer; here’s some of that information before final thoughts… note: they are all different and Wikipedia proves, by its definition, why it’s a pretty useless source for information…  for them a pass in soccer must travel on the ground – no kidding – here’s their definition up front:

“Passing the ball is a key part of association football. The purpose of passing is to keep possession of the ball by maneuvering it on the ground between different players and to advance it up the playing field.”

Other definitions get pretty detailed – it is what it is apparently – complicated…

Passing Definition: About.com World Soccer.

When the player in possession kicks the ball to a teammate. Passes can be long or short but must remain within the field of play.

Soccer Dictionary: Note there are numerous definitions provided in this link so offering up a specific link is troublesome so I will cut and paste those definitions below:

Cross, diagonal: Usually applied in the attacking third of the field to a pass played well infield from the touch-line and diagonally forward from right to left or left to right. Cross, far-post: A pass made to the area, usually beyond the post, farthest from the point from which the ball was kicked. Cross, flank (wing): A pass made from near to a touch-line, in the attacking third of the field, to an area near to the goal. Cross, headers: 64% of all goals from crosses are scored by headers. Cross, mid-goal: A pass made to the area directly in front of the goal and some six to twelve yards from the goal-line. Pass, chip: A pass made by a stabbing action of the kicking foot to the bottom part of the ball to achieve a steep trajectory and vicious back spin on the ball. Pass, flick: A pass made by an outward rotation of the kicking foot, contact on the ball being made with the outside of the foot. Pass, half-volley: A pass made by the kicking foot making contact with the ball at the moment the ball touches the ground. Pass, push: A pass made with the inside of the kicking foot. Pass, sweve: A pass made by imparting spin to the ball, thereby causing it to swerve from either right to left or left to right. Which way the ball swerves depends on whether contact with the ball is made with the outside or the inside of the kicking foot. Pass, volley: A pass made before the ball touches the ground. Passing: When a player kicks the ball to his teammate. Through pass: A pass sent to a teammate to get him/her the ball behind his defender; used to penetrate a line of defenders. This pass has to be made with perfect pace and accuracy so it beats the defense and allows attackers to collect it before the goalkeeper.

Ducksters.com offers up a Glossary and Terms for Soccer; here’s what they define a pass as being…  this one is geared more towards teaching players about various types of passes they will need good skill in order to execute them.

Direct Passes - The first type of soccer pass you learn is the direct pass. This is when you pass the ball directly to a teammate. A strong firm pass directly at the player's feet is best. You want to make it easy for your teammate to handle, but not take too long to get there.

Passes to Open Spaces - Passing into space is an important concept in making passes in soccer. This is when you pass the ball to an area where a teammate is running. You must anticipate both the direction and speed of your teammate as well as the opponents. Good communication and practice is key to good passes into space.

Wall Passes (One-Twos) - Now we are getting into more complex passing. You can think of a wall pass as bouncing a ball off of a wall to yourself. Except in this case the wall is a teammate. In wall pass you pass the ball to a teammate who immediately passes the ball back to you into open space. This helps to keep the defense off balance. This is a difficult maneuver and takes a lot of practice, but the results will make it worth the effort.

Long Passes - Sometimes you will have the opportunity to get the ball up the field quickly to an open teammate. A long pass can be used. On a long pass you kick the ball differently than with other shorter passes. You use an instep kick where you kick the soccer ball with your instep or on the shoelaces. To do this you plant your non-kicking foot a few inches from the ball. Then, with your kicking leg swinging back and bending at the knee, snap your foot forward with your toe pointed down and kick the ball with the instep of your foot.

Backward Pass - Sometimes you will need to pass the ball backward. This is done all the time in professional soccer. There is nothing wrong with passing the ball back in order to get your offense set up and maintain control of the ball.

Now that's probably not 'every' definition available but they pretty much say the same thing apart from ‘on-the-ground’ by Wikipedia – a pass is a transfer of the ball from one player to another…

In closing… 

As noted earlier – I’m not really sure what right looks like but I remain convinced that all these organizations are well-intentioned in offering up free statistics for others to use, be it for analysis, fantasy league or simply to check it out.

In my own effort to develop more comprehensive measurements and indicators a standardized source of data for the MLS would be beneficial – if the intent for MLS is to endorse OPTA then there remains a conflict as Golazo clearly does not use the same data filters as the Chalkboard.

My vote, is and will remain, keep the Chalkboard and then, MLS, consider ways, as OPTA (Perform Group) is now, to improve it for more beneficial analysis.

Here is Part II  - where I peel back a wee bit more - consider these phrases, successful crosses, launches, key passes, through-balls, throw-ins and more, as ASA continues its venture into Soccer Analysis in America.

Here’s a few paraphrased thoughts from other folks who offer up articles on ASA about this issue on passing statistics:

Jared Young – The massive difference in pass data between sites is troubling and disturbing;   I’ve been primarily using whoscored.com and golazo for my numbers so I may have to explore other options.

Cris Pannullo – Major League Soccer should take an initiative and define what pass means in their league; it is surprising that they haven’t given how popular things like fantasy sports are; people eat statistics up in this country.

All the best, Chris

You can follow me on twitter @chrisgluckpwp

Rosales, not Dempsey, is the clear choice for Seattle's set-piece crosses

In Seattle’s 2-1 loss to Portland on Saturday, Clint Dempsey took all of the Sounders’ attacking set-pieces in the first half. He was impressive with his free kick shots on goal, clipping the crossbar and forcing Donovan Ricketts into multiple saves. But his corner kicks left much to be desired. Mauro Rosales subbed on in the 63rd minute and took the remainder of the set-piece crosses and created more chances. With Lamar Neagle suspended for yellow card accumulation and Seattle needing goals in leg two, Rosales seems likely to start. Requisite warning about small sample sizes aside, based off of the results in leg one, the data suggest Sigi Schmidt would be wise to let Rosales take over set-piece crossing duties in the second leg.

Here's how Dempsey’s nine corners and one free kick cross went in leg one:

DempseyLeg1FKs

3rd minute corner: To the near post, cleared by Diego Chara 6th corner: Near post, cleared by Will Johnson 20th corner: Near post, cleared by Will Johnson 25th corner: Near post, cleared by Chara 32nd corner: Near post, cleared by Chara 38th corner: Top of the six yard box, cleared by Pa-Moudou Kah 38th corner: Top of six, cleared by Kah 39th free kick: Cross from 18 yards out on the wing to the top of the six, cleared by Futty Danso 45th corner: Near post, punched clear by Ricketts

In the second half, Rosales took all three Seattle corners and two free kick crosses:

RosalesLeg1FKs

68th minute corner: To the penalty spot, shot by Djimi Traore, saved by Ricketts 69th corner: Top of six, Headed cross by Dempsey  blocked by Zemanski and eventually caught by Ricketts 82nd free kick: Cross from 38 yards in the center to the penalty spot, cleared by Danso 86th free kick: Cross from 28 yards on the wing to the edge of the penalty box, headed by Shalrie Joseph across the box 87th corner: Penalty spot, Headed shot by Dempsey off of the crossbar and out

In summary: Dempsey had 10 set-piece crosses, none of which reached a Seattle teammate. Rosales had five set-piece crosses, four of which found a teammate in the box, and three of which led to shots.

As you can tell, it was a tale of two halves. In the first, Dempsey’s crosses rarely cleared the first defender, and none found another Sounders player. In the second half, four of Rosales’ five crosses created chances, two off of the head of Dempsey himself.

If Seattle is going to win at Jeld-Wen Field on Thursday, they’ll need to do better with their crosses. Based on their chances in game one, it looks to be in the Sounders' best interest to allow Rosales to take the free kick crosses in game two. Not only did his crosses create better chances than Dempsey in game one, but Deuce seems to be more dangerous getting on the end of crosses than he is at taking them.

Squawka Enters MLS Statistic Scene

So last week, ironically at about this exact time, I wrote about WhoScored entering the realm of American soccer and how awesome and exciting it was that they were going to start providing and publishing statistics for MLS---allowing us to skip the process of having to count up all the individual games, not to mention the time-consuming tables that Matty puts together. Now we have much of that information at our convenient disposal. Well we are getting even more spoiled as now Squawka joins the fray of MLS statistics.

If you haven't been to Squawka yet, you need to visit their site. It's not just a great collection of information, it's visually stimulating and helps put things into a context, helping to convey a message better than some writers, especially me, can convey.

This isn't just an awesome thing because it makes mine as well as my associates' lives easier. It's awesome because it's adding to what WhoScored does, not competing with them. This isn't FanGraphs vs. Baseball-Reference where you have similar but altogether different ways of arriving at thoughts and ideas that really confuse the hell out of you---like when you are trying to come up with whether or not Ricky Nolasco had a good season.

Sure there are some subtle differences between the two sites, and even how they end up rating a player. But this isn't about exact sciences at this point. It's more about making data prevalent. A big shout out goes to Nic English and his crew for getting this out there. Job well done.

Game of the Week: (A Rather Late) #LAGvsNYRB Review

We've talked quite a bit about game states on the blog over the last few weeks, both linking certain articles as well as talking about it on the podcast. The ability to take specific events and associate context with them to provide a better understanding of the match results is helpful. However, there are times when I think Game States need to be refined based upon the situation. Take for instance our "game of the week" selection, New York Red Bulls at home against the potent Los Angeles Galaxy. There is a lot I could say about leaving Mike Magee behind in LA and losing Juninho just 10 minutes into the match. Attempting to use the typical goal game state doesn't really work simply because of the lone goal was scored at the 91 minute mark.

If we were looking at this in a season long context and we wanted to see how good a team was in the "even goal state," or maybe how long they played in an even goal state, 90+ minutes of data this match would go towards that game state and presumably help speak to each team's ability. The problem is that on an individual game basis sometimes there is a need for another way to really apply context to this game.

Naturally, with the injury to Juninho the first thought is to apply game states to substitutions rather than goals. The problem with that---omitting Juninho's substitution---is that substitutions take place in bunches in the second at the end of the game. It's becomes difficult to separate where exactly there was a specific difference maker.

So I kind of abandoned the thought of single game states in this scenario and instead looked more for another pattern.

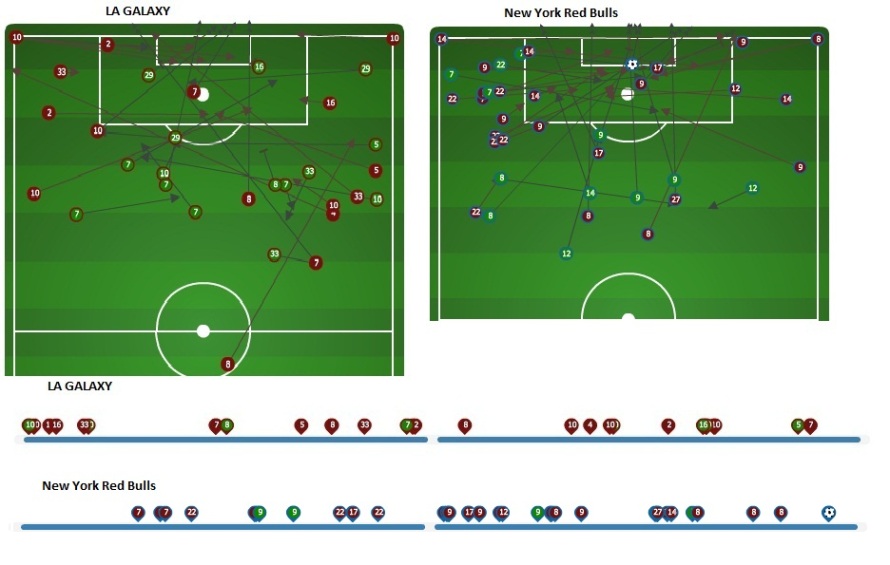
LAGalaxy

Above is a bit from the MLS site chalkboard. Events on the timeline have been taken from each team, and each has a corresponding event associated with it on the map of the pitch. I specifically used offensive-associated filters to help give me an idea of the effectiveness of each team and how often it was involved.

The specific filters used were: Through balls, Crosses (both successful and unsuccessful), Key Passes, Shots on target, shots off target and lastly, blocked shots. These are all decisively aggressive methods that appreciate a teams ability to drive towards the opposing goal. I'm not exactly sure what to make of all it, there are almost distinctive time blocks that belong to each team as they would hold the ball and look for their own attempts on goal.

You can see that each team had a couple of chances in the last 10 minutes and it came down to a bit of luck in the circumstances of the lone goal. The timeline itself looks almost like heart beat rhythm between each team and their respective attempts towards the opposing goal. This is kind of the pattern I was looking to find, but I don't exactly know what to do with it.

In summation of the actual game, you could make some Carlos Cudicini references---see: Matthew Doyle for snark---and put a nice little bow on it. Yes, I do agree that LA's Italian keeper should have come out of his goal to clear the attempt, but I happen to also think that this single game came down to a rather random occurrence. A simple mistake from a goal keeper who has been in residence at some prestigious clubs.

The league average team finishes a shot roughly once every 10 attempts. The New York Red Bulls scored on what was their 10th attempt at goal. While LA was stuck at 9. I know it's not popular but I believe that sometimes it's not necessarily about strategy or anything deep tactically. Instead, maybe it's about fighting for 90 minutes, putting up as many (good) shots as possible and hoping one of them goes in. That sounds a bit Charles Reepish... I know, but sometimes it's true. Sometimes the ball just finds its way into the back of the net.

Humans make mistakes and even the best goal keepers do, too.