Predicting Goals Scored using the Binomial Distribution

Much is made of the use of the Poisson distribution to predict game outcomes in soccer. Much less attention is paid to the use of the binomial distribution. The reason is a matter of convenience. To predict goals using a Poisson distribution, “all” that is needed is the expected goals scored (lambda). To use the binomial distribution, you would need to both know the number of shots taken (n) and the rate at which those shots are turned into goals (p). But if you have sufficient data, it may be a better way to analyze certain tactical decisions in a match. First, let’s examine if the binomial distribution is actually dependable as a model framework. Here is the chart that shows how frequently a certain number of shots were taken in a MLS match.

source data: AmericanSoccerAnalysis

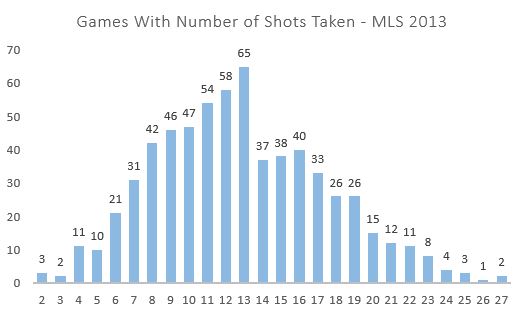
The chart resembles a binomial distribution with right skew with the exception of the big bite taken out of the chart starting with 14 shots. How many shots are taken in a game is a function of many things, not the least of which are tactical decisions made by the club. For example it would be difficult to take 27 shots unless the opposing team were sitting back and defending and not looking to possess the ball. Deliberate counterattacking strategies may very well result in few shots taken but the strategy is supposed to provide chances in a more open field.

Out of curiosity let’s look at the average shot location by shots taken to see if there are any clues about the influence of tactics. To estimate this I looked expected goals by each shot total. This does not have any direct influence on the binomial analysis but could come in useful when we look for applications.

source: AmericanSoccerAnalysis

The average MLS finishing rate was just over 10 percent in 2013. You can see that, at more than 10 shots per game, the expected finishing rate stays constant right at that 10-percent rate. This indicates that above 10 shots, the location distribution of those shots is typical of MLS games. However, at fewer than 10 shots you can see that the expected goal scoring rate dips consistently below 10%. This indicates that teams that take fewer shots in a game also take those shots from worse locations on average.

The next element in the binomial distribution is the actual finishing rate by number of shots taken.

 source: AmericanSoccerAnalysis

Here it’s plain that the number of shots taken has a dramatic impact on the accuracy rate of each shot. This speaks to the tactics and pace of play involved in taking different shot amounts. A team able to squeeze off more than 20 shots is likely facing a packed box and a defense less interested in ball possession. What’s fascinating then is that teams that take few shots in a game have a significantly higher rate of success despite the fact that they are taking shots from farther out. This indicates that those teams are taking shots with significantly less pressure. This could indicate shots taken during a counterattack where the field of play is more wide open.

Combining the finishing accuracy model curve with number of shots we can project expected goals per game based on number of shots taken.

ExpGoalsbyShotsTaken

What’s interesting here is that the expected number of goals scored plateaus at about 18 shots and begins to decline after 23 shots. This, of course, must be a function of the intensity of the defense they are facing for those shots because we know their shot location is not significantly different. This model is the basis by which I will simulate tactical decisions throughout a game in Part II of this post.

Now we have the two key pieces to see if the binomial distribution is a good predictor of goals scored using total shots taken and finishing rate by number of shots taken. As a refresher, since most of us haven’t taken a stat class in a while, the probability mass function of the binomial distribution looks like the following:

source: wikipedia

Where:

n is the number of shots

p is the probability of success in each shot

k is the number of successful shots

Below I compare the actual distribution to the binomial distribution using 13 shots (since 13 is the mode number of shots from 2013’s data set), assuming a 10.05% finishing rate.

source data: AmericanSoccerAnalysis, Finishing Rate model

The binomial distribution under predicts scoring 2 goals and over predicts all other options. Overall the expected goals are close (1.369 actual to 1.362 binomial). The Poisson is similar to the binomial but the average error of the binomial is 12% better than the Poisson.

If we take the average of these distributions between 8 and 13 shots (where the sample size is greater than 40) the bumps smooth out.

source data: AmericanSoccerAnalysis, Finishing Rate model

The binomial distribution seems to do well to project the actual number of goals scored in a game, and the average binomial error is 23% lower than with the Poisson. When individually looking at shots taken 7 to 16 the binomial has 19% lower error if we just observe goal outcomes 0 and 1. But so what? Isn’t it near impossible to predict the number of shots a team will take in the game? It is. But there may be tactical decisions like counterattacking where we can look at shots taken and determine if the strategy was correct or not. And a model where the final stage of estimation is governed by the binomial distribution appears to be a compelling model for that analysis. In part II I will explore some possible applications of the model.

Jared Young writes for Brotherly Game, SB Nation's Philadelphia Union blog. This is his first post for American Soccer Analysis, and we're excited to have him!

North American Soccer League and its 2013 First Half

The last 12 months have been rather eventful for the North American Soccer League (NASL). A league that once folded before some of us were born has begun to become some what relevant again. Even putting aside the excitement surrounding the return of the New York Cosmos to professional soccer---a team that is surrounded and entrenched in US Soccer history---one sees how well the league fared against some of the MLS clubs. NASL knocked out two of the big dogs in the LA Galaxy (2-0, Carolina RailHawks) and Seattle Sounders FC (1-0, Tampa Bay Rowdies) this past year.

Add that to the expansion plans of the league outside of New York. This past year they've added Indianapolis, Jacksonville and Oklahoma City to their growing portfolio. These were shrewd moves to get toe holds in two cities that have limited professional sports and strengthen their ties in Florida, what with three soccer cities in South Florida and four in the Southeastern region.

The league is obviously poised for a positive return.

Living in Tampa for the next few months, I plan on taking in at least one match (this weekend in their Derby game vs. Fort Lauderdale) and checking out the scene.

Okay, there is the narrative. Let's take a look at the table and some numbers:

Shot info

NASL2

Advanced Shot Info

NASL

Table Data

NASL1

Okay, my new friends here in Tampa won't like this very much but Fort Lauderdale should have finished much higher in the table. The disparity in the table between Minnesota and the Strikers is amazing considering the shot data. Though, between expected points and PDO, maybe United FC finished about where they should expect.

There is surprisingly a lot of data in these supplied match reports. I know it may not seem like it, but there is. The time stamped shots can give us a bit more insight to the context of the shots. While we still can't get to know some of the players (outside of the goal scorers) as well, it helps us get to know the teams as a whole within that league.

You can say what you want, but I love the idea of NASL growing and becoming legit competition with MLS. I love USL, NASL and MLS playing in the Open Cup, and I love seeing the sport grow in the country.

I'll continue to throw NASL data out as I collect it. With my new city having an NASL team and a derby game this weekend, I thought it a great time to put this stuff out there. Now talk among yourselves...

PDO: Week 22 Rankings

I dropped the ball a bit last week not updating the tables. Here is how they look as of this past weekend's results.

Team Shots Against GA Sv% SoT GF SH% TSR Points Games PPG PDO
Portland Timbers 89 20 77.53% 101 30 29.70% 0.532 34 21 1.62 1072
New England Rev. 85 19 77.65% 84 22 26.19% 0.497 30 21 1.43 1038
New York Red Bulls 92 27 70.65% 88 29 32.95% 0.489 35 22 1.59 1036
Houston Dynamo 83 20 75.90% 81 22 27.16% 0.494 30 20 1.5 1031
Salt Lake 102 24 76.47% 121 32 26.45% 0.543 37 22 1.68 1029
Dallas 109 27 75.23% 98 27 27.55% 0.473 32 21 1.52 1028
Vancouver Whitecaps 92 29 68.48% 98 32 32.65% 0.516 32 21 1.52 1011
Philadelphia Union 97 30 69.07% 102 32 31.37% 0.513 34 22 1.55 1004
Seattle Sounders FC 80 22 72.50% 76 21 27.63% 0.487 28 19 1.47 1001
Colorado Rapids 92 24 73.91% 91 23 25.27% 0.497 34 23 1.48 992
Montreal Impact 92 29 68.48% 105 31 29.52% 0.533 35 20 1.75 980
Columbus Crew 99 27 72.73% 94 23 24.47% 0.487 23 21 1.1 972
Kansas City 63 21 66.67% 103 29 28.16% 0.620 36 22 1.64 948
San Jose Earthquakes 109 33 69.72% 87 21 24.14% 0.444 27 22 1.23 939
CD Chivas USA 118 37 68.64% 69 17 24.64% 0.369 17 21 0.81 933
L.A. Galaxy 76 27 64.47% 108 30 27.78% 0.587 33 22 1.5 923
Toronto FC 77 29 62.34% 69 17 24.64% 0.473 17 21 0.81 870
Chicago Fire 85 30 64.71% 103 20 19.42% 0.548 25 20 1.25 841
DC 93 35 62.37% 62 8 12.90% 0.400 10 21 0.48 753

Again, Portland, even with their loss, retains their title as the luckiest club in MLS by PDO*. Meanwhile, New England continues to mystify as they pretty much pulled that win together with duct tape, spit and some wood glue. Is Jay Heaps really Macgyver? I'm going to guess no, though as we talked about on the podcast, home field advantage not only helps to place pressure on the ref, but it may also encourage more aggression from the home side. One can only wonder if Jay Heaps is able to simulate this effect with a stirring pep talk prior to the match against a terrible team on the road.

However, just like how Chivas and Toronto have been largely unaffected this season, likely due to some terrible play and a limited talent base, you have to wonder if we are seeing many of these clubs performing at their true rates. I don't think you can completely attribute RSL's finishing success to luck when defensively they have some great pieces and offensively they, again, have some great pieces.

As we watch the year unfold it's going to be rather interesting to see where these clubs end up with playoff spots at seasons end.


*PDO here is based on shots on target, not total attempts. 

PDO: Week 20 Update

Last week, we talked about PDO...a lot. We likely will continue to talk about PDO and monitor it through the season. After games played this past weekend here are the up-to-date rankings. I know that Matthias usually just updates his page on Monday, but I'm actually going to make these a post so that when I want to do a week-by-week investigation later on this off-season, it saves me time. Because it's all about me.

Team SA GA GA% Sv% SF GF SH% TSR Points Games PPG PDO
Portland Timbers 83 18 0.22 0.78 93 30 0.32 0.528 33 19 1.74 1106
New England Rev. 75 16 0.21 0.79 72 22 0.31 0.490 24 18 1.33 1092
Real Salt Lake 87 18 0.21 0.79 112 32 0.29 0.563 37 20 1.85 1079
New York Red Bulls 83 24 0.29 0.71 79 29 0.37 0.488 31 20 1.55 1078
Seattle Sounders FC 73 20 0.27 0.73 61 21 0.34 0.455 24 17 1.41 1070
Houston Dynamo 76 19 0.25 0.75 76 22 0.29 0.500 29 19 1.53 1039
Vancouver Whitecaps 81 26 0.32 0.68 91 32 0.35 0.529 32 19 1.68 1031
FC Dallas 105 27 0.26 0.74 96 27 0.28 0.478 31 20 1.55 1024
Colorado Rapids 81 22 0.27 0.73 80 23 0.29 0.497 27 20 1.35 1016
Philadelphia Union 88 30 0.34 0.66 93 32 0.34 0.514 30 20 1.50 1003
Columbus Crew 90 23 0.26 0.74 89 23 0.26 0.497 23 19 1.21 1003
Montreal Impact 91 29 0.32 0.68 97 31 0.32 0.516 31 18 1.72 1001
Sporting Kansas City 56 19 0.34 0.66 92 29 0.32 0.622 33 20 1.65 976
L.A. Galaxy 70 24 0.34 0.66 100 30 0.30 0.588 30 20 1.50 957
San Jose Earthquakes 105 32 0.30 0.70 84 21 0.25 0.444 24 21 1.14 945
CD Chivas USA 107 35 0.33 0.67 63 17 0.27 0.371 14 19 0.74 943
Toronto FC 77 27 0.35 0.65 59 17 0.29 0.434 13 18 0.72 937
Chicago Fire 77 28 0.36 0.64 91 20 0.22 0.542 21 18 1.17 856
DC United 81 29 0.36 0.64 56 8 0.14 0.409 10 19 0.53 785

This week you see Montreal continue to sit somewhere rather neutral in the luck department. Interesting situation after reading Richard Whittall's weekly analytic piece on the Canadian club yesterday. Even more-so when considering some of the screaming by the press and cries about replacing possibly replacing Marco Schallibaum  at the helm...in fact I kind of think it's down right crazy. I wouldn't considered the Impact to be a Supporter Shield contender---that's just me---but it also doesn't mean they won't be. Their points-per-match total is third in MLS, and they still have one-two games in hand on the clubs ahead of them.

Speaking of the East. The New York Red Bulls continue their rise up the luck charts. Something to consider after defeating the Impact 4-0 this week and all the talk about "finally coming together". Remember this graphic is about luck, not about talent. That is to say, be careful about high and lofty dreams, east siders. I can see the Red Bulls struggling to retain that first place position.

Another riser, this one out west, is Vancouver. They are on their way up with the recent performances of Kenny Miller, Camilo and Brad Knighton. Their 1.68 points-per-game average have them quietly (or, of late, not so quietly) contending for a top-3 playoff position ahead of Dallas, LA and Seattle. Something to take note and see whether they are truly overachieving and just on a hot-streak, or finally hitting a much-needed groove.

Lastly, on the subject of FC Dallas, I think it's interesting how they've held pretty firm with a PDO over 1000. Expect them to continue to regress over the next few weeks. The number of shots that they are allowing to reach Raul Fernandez is quiet surprising, and the fact that they are producing an above average save% makes me question how much longer they'll stick around. Though, admittedly, much of that has been due to George John being MIA. His return from the hamstring strain will be crucial to stopping attacks before they get to the keeper.

Montreal's Paradox

If you have listened to our podcasts or read through our stuff, you will have heard us talk about shot ratios a lot. That's how many shots a team gets divided by how many shots its allows its opponents. A shot ratio of 1.5, for example, means that a team gets one-and-a-half times as many shots as its opponents. When soccer teams create extra opportunities for themselves, it generally leads to more goals and more points in the standings. And then there’s Montreal. The Montreal Impact has been something of a Cinderella story this season, at least statistically. Leading up to its matchup with the Chicago Fire on Saturday, the Impact had recorded the second-worst shot attempt ratio in the entire league. Montreal had earned just 61 shot attempts with 28 on target to its opponents’ 95 shot attempts with 32 on target.  Yet somehow, the Impact had maintained a positive goal differential (+2) and the second-most points per match right behind FC Dallas.

Against Chicago, Montreal not only won on the scoreboard two-nil, it also won the shooting and possession battles. But that is a rare feat this year for the Impact, and it’s worth posing the question: Has Montreal been lucky this season, or does it do things that shot ratios and possession just can’t explain?

Using just shots on goal for now, I regressed goal scoring ratios against shot ratios to see how teams “should do,” as if shots on goal were the only thing that matter. Even this early in the season, the regression was not all that bad (R2 = 0.4). It also said that Montreal’s 0.94 shot ratio should lead to about the same goal ratio.* Well that makes sense. If you generate roughly the same number of shots on target as your opponents, you should score about the same number of goals. The Impact, however, have scored nine goals to its opponents’ five—a 1.8 ratio, or +4 differential, if you prefer.

An obvious thing to consider is finishing rate. Despite being outshot, the Impact players finish their attempts with goals more than twice as efficiently as opponents do. That ratio is the best in the league. My first instinct is that the Impact has been somewhat lucky, and that opponents will start to finish with more frequency. But there are two possible explanations I want to explore first before waving the cliché luck flag: the quality of opportunities for Montreal and the quality of opportunities for its opponents.

Harrison talked a little bit about Montreal’s counter-attacking style during a recent podcast, and there’s a possibility that the Impact’s style allows low-quality opportunities to its opponents, leading to higher-percentage opportunities for itself on the counter attack. (Before we investigate, it should be noted that Montreal’s schedule has featured teams that average out to be, well, league-average when it comes to finishing.)

Let’s take Saturday’s match against the Fire as an example of the tools I’m using. Check out the Opta chalkboard for yourself here, and you can see from where teams are shooting and scoring by clicking the appropriate boxes for team and statistic of interest. During this particular game, I have Montreal down for 16 scoring attempts, nine from outside the box, six inside, and one from right on the edge. Both its goals were scored from inside the box (though you could argue one was one the edge). Chicago, on the other hand, earned 11 attempts, ripping seven of those from outside the box, just two from inside, and two from the edge of the box. Chicago did not score. I did this for each of Montreal's seven games this season.

Obviously things like angle matter, too, but I’m not going to pull out my protractor for this one. Here’s the breakdown for Montreal and its opponents on the season:

Attempts Goals Finishing
Stat Montreal Opponents Montreal Opponents Montreal Opponents
Inside Box

40

45

6

4

15.0%

8.9%

Outside Box

31

56

3

1

9.7%

1.8%

On Edge

6

5

0

0

0.0%

0.0%

Total

77

106

9

5

11.7%

4.7%


Montreal earns more shots inside the box than outside, and that might very well be a product of its system and players, rather than just dumb luck. While the Impact is being outshot in total, perhaps that stat is skewed slightly by shot selection. Montreal's system seems to create a greater proportion of opportunities in the box. I would still expect some regression from Montreal this season back toward the middle of the standings—as its shot ratios are not favorable even after adjusting for quality—but perhaps not as far as a simple shot model would suggest.

*One might note that Montreal’s attempts ratio is quite a bit worse than its shots-on-goal ratio, which isn’t even that good to begin with. It is apparently too early in the season for attempts ratios to explain much of anything with certainty, but shots models from past seasons suggests Montreal’s goal scoring ratio should probably be even worse than even-ish. That is, if shots aren't broken down by quality.