Europe, Money, and the Problem with Disparity

American Soccer Analysis has been in the analytics game since 2013, and, early on in this project, we noticed something that’s always troubled us when it comes to taking the seminal analytics studies and concepts developed in Europe and applying it to an MLS data-set. To put it frankly, they don’t work as well.

Read More

The Evolution of MLS Penalty Kicks (and How to Fix Them)

The Evolution of MLS Penalty Kicks (and How to Fix Them)

Back in 2017, Vox published a video summarizing research from Michael Mauboussin’s book The Success Equation, which ranked the major team sports on a scale of luck to skill using a formula that included games played, player size, number of possessions, chances, and various other factors. This research wasn’t intended to measure player skill—surprise! professional athletes tend to be very skillful at their chosen sport—but rather how well their sports “capture” that skill. in other words, the study sought to show how well results in those sports could be predicted by player skills. Soccer—specifically, the Premier League—came out as the second most “skill-based” of the major sports, ranking behind only basketball in terms of its non-randomness. Still, as anyone who’s watched any CONCACAF matches can attest, luck is an, um, “relevant” factor in the outcome of a match.

Still, beyond the obvious instances of human fallibility (and the question of if and how much the introduction of VAR has reduced this “luck factor” is a question that should be explored in more depth) the video brings up the question of what aspects of the sport are “lucky” vs. “skilled”, and whether the existing balance of those two is the most desirable.

Read More

Expected Goal Chains: The Link between Passing Sequences and Shots

Expected Goal Chains: The Link between Passing Sequences and Shots

For those who are not familiar with Expected Goal Chains (xGC), the metric looks at all passing sequences that lead to a shot and credits each player involved with the xG. Instead of just looking at expected goals and expected assists, which primarily benefits strikers and attacking midfielders, xG Chains is beneficial to every player involved in a sequence. Most importantly xGC credits those defensive or two-way players who are integral to a play’s build-up but don’t necessarily serve that final key pass. To calculate xGC, I assembled every pass, shot, foul, and defensive action so far in MLS and assigned a unique ID to each passing sequence. When a sequence ended in a shot, each player is attributed with the xG from that shot. StatsBomb defines it very succinctly, so the below steps are stolen directly from them: 

Read More

NYCFC, Expected Goals, and Fantasy Sports

NYCFC, Expected Goals, and Fantasy Sports

It’s no surprise that expected goals is finally being talked about in the fantasy sports realm. This is great and it’s really entertaining to me because, as you might expect, it’s where we at ASA often use it the most. It’s an incredibly useful tool that can provide some quick tools for judging players when needed.

Now, let’s talk about how we’re using it.

Expected goals is, as we have well documented over the years, a measure of the opportunities and chances created by a player and their team. Porting that to the fantasy soccer realm there are terms and conditions on this that we need to consider.

Expected goals isn't a one-stat-fits-all for all metrics. Rather it’s a sum of many parts. Looking over at NYCFC and the fact that they’re killing it with the highest expected goal differential is great! But—realizing how they’re doing is even more important as that speaks to the sustainability of their success.

Read More

Adrian Heath’s High Risk Approach to Defense

Adrian Heath’s High Risk Approach to Defense

With Jeff Cassar’s firing last Monday and the announcement of Mike Petke as the new RSL coach, part of the conversation among MLS fans and analysts turned to which remaining coach held the hottest seat. The top candidates included Dom Kinnear, Jay Heaps, and Carl Robinson. Also in the discussion, at least somewhat seriously, was Minnesota United’s Adrian Heath, a man who has been at the helm there for four total games. Over those four games Minnesota has conceded a league worst 18 goals, for a goal difference of -12. They've allowed 38 shots from inside their 18, including nine shots from inside the six yard box. Both are the most in the league (and second most on a per game basis). That Heath’s name comes up in the conversation suggests an overall lack of preparedness that, to some, might be damning.

I don’t want to beat a dead horse here. A lot has already been written on Minnesota’s defensive flaws (including from our own Harrison Crow), and I don’t want to pile on. I’m more concerned about answering whether these struggles could've been anticipated in light of Heath’s performance managing Orlando City’s 2015 expansion campaign. Are the problems Minnesota now faces the same that plagued Orlando City that season? And, if so, does Orlando City’s experience point towards a solution?

Read More

Validating the ASA xGoals Model

Validating the ASA xGoals Model

It was more than two years ago that we built the current model for determining the expected goals of each shot, so let’s go back and see how it’s doing. I've included some R code for fitting our generalized linear model (GLM), as well as a gradient-boosted tree model (GBM) for making comparisons. I selected the training dataset to be shots from 2011 - 2014, and the validation dataset to be shots from 2015 and 2016. Actual and predicted goals per shot are shown across each variable of the model.

First, I fit the original model as seen on the ASA website. This is a logistic generalized linear model, which is designed to predict the probability of binary outcomes like shots (goal vs. not goal). Coefficients will differ somewhat from what we posted long ago, as this is a different training dataset.

Read More

Tactics, Talent, and Success: Diversity in Scoring and Chance Creation

Tactics, Talent, and Success: Diversity in Scoring and Chance Creation

I’ve been wondering for some time about soccer teams’ reliance on star power and top statistical producers. Is it really a good strategy? Are teams with one main goal scorer or playmaker easier to “figure out”? When the game is on the line, is a singular threat easier to neutralize than a team with a plethora of attacking options? And would this kind of reliance actually hamper a team’s success across a season?

My skepticism must seem foolish to European executives, given the huge fees Gonzalo Higuain and Paul Pogba went for this summer. But the conventional wisdom is different in the American sports landscape. In our most popular sports, one person simply can’t do it all. Here, Defense Wins Championships. The San Antonio Spurs, the best NBA team of the past two decades, emphasize team play over everything. Peyton Manning was completely underwhelming in both of his Super Bowl wins, needing his incredible teams to carry him to glory. One star pitcher or one star hitter is simply not capable of winning a World Series on their own. The anecdotal evidence even appears in MLS. Chris Wondolowski’s 27 goals in 2012 didn’t get the Earthquakes past the first round of MLS playoffs; neutralize MVP Sebastian Giovinco, and 2015’s Toronto FC didn’t have much else to offer.

More after the jump.

Read More

Does Maxi Urruti meet FC Dallas’ Requirements of a 15-20 Goal Scorer?

FC Dallas Technical Director Fernando Clavijo stated in the 2015-2016 offseason that his goal was to “try to find that player that can score 15, 20 goals, that can compete for the Golden Boot at the end of the year.” Is Maxi Urruti the striker that can score 15 goals this year, or should Clavijo go shopping this summer to find his desired striker?

More after the jump.

Read More

Does Finishing Skill matter in MLS?

If you’ve ever played FIFA, you’ve probably noted the importance of a forward’s “finishing” rating to how often they finish their chances. That’s how it works in the video game, but is “finishing” a real life skill significant enough to make an impact in a forward’s goal scoring tally?

While I have yet to meet a data analyst who thinks that “finishing skill” is as relevant to goal scoring as most soccer fans tend to believe, there doesn’t seem to be a consensus in terms of whether “finishing” is a repeatable skill. In other words, can forwards depend on a superior ability to convert chances year to year?

With forwards like Gyasi Zardes (16 goals in 2014) and Cyle Larin (17 goals in 2015) bursting onto the scene by converting a high percentage of their chances on goal, the question within MLS is as important as ever. Are these players scoring so many goals because of some underlying finishing skill, or are their unusually finishing rates something closer to statistical noise?

Is finishing a skill of any importance within MLS?

One important tool we can use for answering such a question is to study discrepancies in expected goals (xG) data. Since the expected goals model is built around league averages of conversion, if finishing were a skill of any statistical note we would see a consistent out-performance of the model by certain shooters who are highly skilled finishers. But before we get into repeatability for individuals, I’d like to use goals minus expected goals (G-xG) data to look at the question in much broader strokes.

More after the jump.

Read More

Predicting Goals Scored using the Binomial Distribution

Much is made of the use of the Poisson distribution to predict game outcomes in soccer. Much less attention is paid to the use of the binomial distribution. The reason is a matter of convenience. To predict goals using a Poisson distribution, “all” that is needed is the expected goals scored (lambda). To use the binomial distribution, you would need to both know the number of shots taken (n) and the rate at which those shots are turned into goals (p). But if you have sufficient data, it may be a better way to analyze certain tactical decisions in a match. First, let’s examine if the binomial distribution is actually dependable as a model framework. Here is the chart that shows how frequently a certain number of shots were taken in a MLS match.
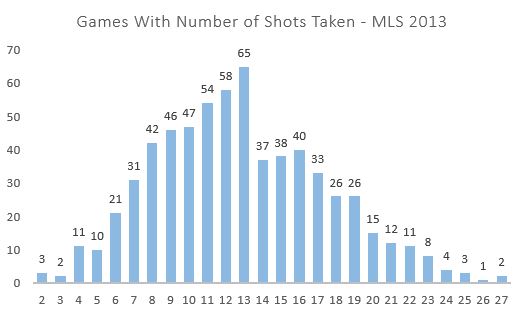
source data: AmericanSoccerAnalysis

The chart resembles a binomial distribution with right skew with the exception of the big bite taken out of the chart starting with 14 shots. How many shots are taken in a game is a function of many things, not the least of which are tactical decisions made by the club. For example it would be difficult to take 27 shots unless the opposing team were sitting back and defending and not looking to possess the ball. Deliberate counterattacking strategies may very well result in few shots taken but the strategy is supposed to provide chances in a more open field.

Out of curiosity let’s look at the average shot location by shots taken to see if there are any clues about the influence of tactics. To estimate this I looked expected goals by each shot total. This does not have any direct influence on the binomial analysis but could come in useful when we look for applications.

source: AmericanSoccerAnalysis

The average MLS finishing rate was just over 10 percent in 2013. You can see that, at more than 10 shots per game, the expected finishing rate stays constant right at that 10-percent rate. This indicates that above 10 shots, the location distribution of those shots is typical of MLS games. However, at fewer than 10 shots you can see that the expected goal scoring rate dips consistently below 10%. This indicates that teams that take fewer shots in a game also take those shots from worse locations on average.

The next element in the binomial distribution is the actual finishing rate by number of shots taken.

 source: AmericanSoccerAnalysis

Here it’s plain that the number of shots taken has a dramatic impact on the accuracy rate of each shot. This speaks to the tactics and pace of play involved in taking different shot amounts. A team able to squeeze off more than 20 shots is likely facing a packed box and a defense less interested in ball possession. What’s fascinating then is that teams that take few shots in a game have a significantly higher rate of success despite the fact that they are taking shots from farther out. This indicates that those teams are taking shots with significantly less pressure. This could indicate shots taken during a counterattack where the field of play is more wide open.

Combining the finishing accuracy model curve with number of shots we can project expected goals per game based on number of shots taken.

ExpGoalsbyShotsTaken

What’s interesting here is that the expected number of goals scored plateaus at about 18 shots and begins to decline after 23 shots. This, of course, must be a function of the intensity of the defense they are facing for those shots because we know their shot location is not significantly different. This model is the basis by which I will simulate tactical decisions throughout a game in Part II of this post.

Now we have the two key pieces to see if the binomial distribution is a good predictor of goals scored using total shots taken and finishing rate by number of shots taken. As a refresher, since most of us haven’t taken a stat class in a while, the probability mass function of the binomial distribution looks like the following:

source: wikipedia

Where:

n is the number of shots

p is the probability of success in each shot

k is the number of successful shots

Below I compare the actual distribution to the binomial distribution using 13 shots (since 13 is the mode number of shots from 2013’s data set), assuming a 10.05% finishing rate.

source data: AmericanSoccerAnalysis, Finishing Rate model

The binomial distribution under predicts scoring 2 goals and over predicts all other options. Overall the expected goals are close (1.369 actual to 1.362 binomial). The Poisson is similar to the binomial but the average error of the binomial is 12% better than the Poisson.

If we take the average of these distributions between 8 and 13 shots (where the sample size is greater than 40) the bumps smooth out.

source data: AmericanSoccerAnalysis, Finishing Rate model

The binomial distribution seems to do well to project the actual number of goals scored in a game, and the average binomial error is 23% lower than with the Poisson. When individually looking at shots taken 7 to 16 the binomial has 19% lower error if we just observe goal outcomes 0 and 1. But so what? Isn’t it near impossible to predict the number of shots a team will take in the game? It is. But there may be tactical decisions like counterattacking where we can look at shots taken and determine if the strategy was correct or not. And a model where the final stage of estimation is governed by the binomial distribution appears to be a compelling model for that analysis. In part II I will explore some possible applications of the model.

Jared Young writes for Brotherly Game, SB Nation's Philadelphia Union blog. This is his first post for American Soccer Analysis, and we're excited to have him!