

A Week One Break Down Of Shot Locations, Final Third Passes and xGF
/HEY EVERYONE, WE HAD A WEEK OF SOCCER! YAY! Taking a quick look at this ghetto chart that I made, we see a little break down of the shot locations as well as some of the final third possessions. I'm still searching for the best way to display this data, but there are some interesting things here. For instance, I feel a lot less silly about starting Robbie Keane on my fantasy team after a quick look at the Galaxy's xGF, as he really should have scored at least one goal from the run of play--oh and then there is the whole business of missing the penalty kick. Besides that, we can also see that New York Red Bulls were forced into long range shots and couldn't dangerously penetrate the 18-yard box despite being one of three clubs with more than 100 touches inside the attacking third.
| Team | Att1 | xG1 | Att2 | xG2 | Att3 | xG3 | Att4 | xG4 | Att5 | xG5 | Att6 | xG6 | xGF | Passes Completed | Total Passes | AP% |
| Sounders | 0 | 0 | 0 | 0 | 2 | 0.142 | 7 | 0.371 | 0 | 0 | 0 | 0 | 0.513 | 57 | 102 | 0.559 |
| Sporting | 0 | 0 | 2 | 0.354 | 3 | 0.213 | 3 | 0.159 | 1 | 0.023 | 0 | 0 | 0.749 | 45 | 86 | 0.523 |
| Chivas | 0 | 0 | 4 | 0.708 | 2 | 0.142 | 4 | 0.212 | 0 | 0 | 0 | 0 | 1.062 | 88 | 137 | 0.642 |
| Fire | 0 | 0 | 0 | 0 | 1 | 0.071 | 4 | 0.212 | 0 | 0 | 0 | 0 | 0.283 | 58 | 85 | 0.682 |
| Galaxy | 0 | 0 | 8 | 1.416 | 4 | 0.284 | 13 | 0.689 | 0 | 0 | 0 | 0 | 2.389 | 116 | 147 | 0.789 |
| RSL | 0 | 0 | 4 | 0.708 | 1 | 0.071 | 3 | 0.159 | 0 | 0 | 0 | 0 | 0.938 | 75 | 104 | 0.721 |
| Timbers | 0 | 0 | 6 | 1.062 | 1 | 0.071 | 5 | 0.265 | 0 | 0 | 1 | 0.035 | 1.433 | 106 | 154 | 0.688 |
| Union | 0 | 0 | 2 | 0.354 | 2 | 0.142 | 4 | 0.212 | 0 | 0 | 0 | 0 | 0.708 | 68 | 105 | 0.648 |
| Dynamo | 0 | 0 | 10 | 1.77 | 2 | 0.142 | 6 | 0.318 | 0 | 0 | 0 | 0 | 2.23 | 70 | 105 | 0.667 |
| Revolution | 0 | 0 | 5 | 0.885 | 3 | 0.213 | 6 | 0.318 | 1 | 0.023 | 1 | 0.035 | 1.474 | 60 | 103 | 0.583 |
| FC Dallas | 0 | 0 | 3 | 0.531 | 4 | 0.284 | 4 | 0.212 | 0 | 0 | 0 | 0 | 1.027 | 81 | 115 | 0.704 |
| Impact | 0 | 0 | 7 | 1.239 | 1 | 0.071 | 6 | 0.318 | 0 | 0 | 0 | 0 | 1.628 | 60 | 107 | 0.561 |
| Whitecaps | 0 | 0 | 5 | 0.885 | 3 | 0.213 | 6 | 0.318 | 0 | 0 | 0 | 0 | 1.416 | 86 | 125 | 0.688 |
| NYRB | 0 | 0 | 1 | 0.177 | 1 | 0.071 | 5 | 0.265 | 0 | 0 | 0 | 0 | 0.513 | 100 | 139 | 0.719 |
| DC United | 0 | 0 | 6 | 1.062 | 0 | 0 | 3 | 0.159 | 1 | 0.023 | 0 | 0 | 1.244 | 80 | 119 | 0.672 |
| Crew | 0 | 0 | 4 | 0.708 | 0 | 0 | 4 | 0.212 | 1 | 0.023 | 0 | 0 | 0.943 | 74 | 104 | 0.712 |
| Total | 0 | 0 | 67 | 11.859 | 30 | 2.13 | 83 | 4.399 | 4 | 0.092 | 2 | 0.07 | 18.55 | 1224 | 1837 | 0.666 |
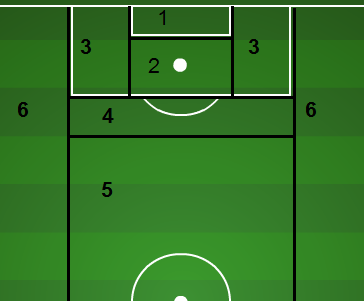 Zones 1-6 have been broken down by Matthias previously, and correspond to the map displayed on the right. xGF is simply expected goals for, and AP% is simply attacking passing percentage.
Looking at the xGF, shot location would predict approximately 18-19 goals being scored when in reality there were 26 total goals put through the back of the net. The shot locations were compiled using mlssoccer.com's Golazo and I'm not sure that the locations were entirely accurate. I plan on doing a bit of a look into how the break down works in regards to Goalzo versus the Chalkboard, and I really think that the use of the chalkboard will yield better prediction numbers, but that's purely a suspicion of mine.
Overall it'll be interesting to monitor this break down, and with that, maybe next time I'll do an xGD where teams could project how many "points" that they should have based on whether or not they should have won, drawn or lost a match. Taking that a step further it'll be interesting to see if the first 17 games has any insight to the next 17 games of the season. Here we go!