2016 ASA PREVIEW: LOS ANGELES GALAXY

The LA Galaxy had an interesting off-season. It started with the release of Omar Gonzalez and Juninho, followed by the pursuit of Ashley "barely still plays soccer" Cole. The Galaxy took a lot of heat for this pursuit when it was reported they would be using TAM, but anger seems to have dissipated when it was announced that price was closer to 300k. In reality, people should still be getting angry that the Galaxy spent 300k on a 35 year old left back of questionable fitness, but the Galaxy narrative machine is simply too strong for such a reasoned fan reaction. 

The Galaxy further wasted their money on the head scratching signing of Jeff Larentowicz, who demands far more money than he is worth, free agent money on Mike Magee, despite having one of the most promising young talents in the country in Jose Villarreal providing cover at left mid and forward, and finally, paying high dollar for one of the most overrated keepers in MLS history

In their frenzy to blow their newly acquired cap space in the most inefficient way possible, the Galaxy actually managed to stumble their way into three key moves. The first was the signing of Emannuel Boateng, a promising young winger who has impressed in preseason. His speed and dribbling ability should offer a new facet to the Galaxy attack, although Sebastian Lletget is still projected as the starting left mid once he recovers from his groin injury.

The second was the use of TAM to acquire Jelle Van Damme from Standard Liege in Belgium. Van Damme is a physical defender who looks to be a real aerial presence and danger on set-pieces, and, for Galaxy fans, it’s best to keep the mind on his talents and not that time he called Oguchi Onyeywu a dirty monkey, which the Galaxy TOTALLY addressed by getting quotes from lots of people not named Jelle Van Damme about how that’s completely in the past.  (Fans somehow bought it because, again, the Galaxy narrative machine is all powerful).

More after the jump

Read More

2015 ASA Preview: LA Galaxy

*xG = expected goals, xA = expected assists, xGD = expected goal differential. For more information see our xGoals by Team page.

By Sean Steffen (@seansteffen)

With the retirement of Landon Donovan, the Galaxy have lost a player who in large part defined their identity. To say that the LA Galaxy are a team in flux is an understatement, which makes making predictions about next season a fool’s errand. But the fear of looking foolish has never been an adequate deterrent in my writing career, so let’s give this a shot. 

Let’s make no mistake about it: Landon Donovan was a chance creating God.  Last year 32.2% of the Galaxy’s total xG came from either a Donovan shot or pass. His stylistic impact on the team was perhaps even greater. This can be backed up by my own recent passing analysis of the team which can be read here

In short, I isolated two distinct buildup styles that the 2014 Galaxy employed to score and Donovan was involved in 75% of them. He was also the driving force behind the famed "Tiki-Taco" style of play which lead to Gyasi Zardes getting so many uncontested shots within the box, a phenomenon I wrote about here. Now that 75% is admittedly skewed somewhat by my methodology since my article was aimed more at analyzing style than overall number, however, if does show that Donovan either scored or was within four passes of a bare minimum of 39% of the Galaxy’s assisted non-set-piece goals.

It took a lot of math, but I think we've finally proven this Donovan fellow was pretty good at soccer. The obvious question becomes, who replaces him, and how does that effect the Galaxy’s xG numbers? This is a huge question mark because the Galaxy have played few preseason games and have rotated players at left mid to a point that it’s impossible to guess who will be starting. As of now, Bradford Jamieson IV looks to be Bruce’s pick to be the starting left mid on opening day (whenever that will be).  We have no data available on Jamieson, but his season in USL Pro last year suggests he will be a player that will contribute mainly by way of expected goal and will have few expected assists. Now, from a numbers standpoint, a goal is a goal, however, the expected goal numbers of an entire team fall when chance creation is depleted, which is a very real possibility for the Galaxy next year. 

Luckily for the Galaxy, however, their expected goal difference totals from last year were so great, that they actually have a considerable amount of xG to give, if the defense can remain consistent. I addressed this quite thoroughly in this article, but here is a key takeaway

Team Expected Goal differential per 90
2014 LA Galaxy 0.88
2014 Seattle 0.41
2012-2014 Avg. Supporters Shield Winner 0.28
2012-2014 Top of the West 0.34

The Galaxy somehow managed to lose the Supporters' Shield race last year despite a redonkulous xG differential. This is can be viewed as a cushion, of sorts, because it means that, with a bit more luck and better game management, the Galaxy can lose a lot of xG and still be a top team. Here are the quick hit points. 

From a numbers standpoint, the Galaxy could replace Donovan with a player that contributes 0 xG by way of shot or pass and would still have a 0.43 xG lead on the Supporters' Shield average over the course of a full season. If you apply the same neutral left mid scenario to the average for teams that finished top of the west over that period, the  Galaxy only fall under the western mark by 1.39xG. And finally, subtracting Donovan’s output last year still only puts the Galaxy 3.88 xG behind Seattle in xG differential. That’s a marginal difference, and one that can be easily overcome by a combination of Stefan Ishizaki shouldering more of the chance creation load, and the xG Bradford Jamieson IV brings to the table. 

There is also the matter of Steven Gerrard, who arrives in mid July, and will surely boost the Galaxy’s numbers; however, his impact on the Galaxy’s xG Differential numbers will probably be a bit more complex than him boosting xGF. History suggests that his addition might be at the expense of more shots against.  

You see, the data we have on the Galaxy is interesting. The first year available is from the famous 2011 team, who many consider to be the greatest MLS team of all time. Of the four total years of data, we have two years in the Beckham era and two years in the post Beckham era. During the Beckham years, the Galaxy played a lethal brand of counter-attack soccer. In the years following Beckham, the Galaxy became an elite possession team. Over the four years of data, the Galaxy won three MLS cups, but by using two very distinct styles of soccer. 

Why do I even bring this up? The data clearly shows that the Galaxy’s defense improved by leaps and bounds in the post Beckham years. This may come as a shock to some, as the 2011 LA Galaxy team is generally regarded as one of the best defensive sides of all time, sporting a goals against average of 0.79 a game,  however, the data suggests that the Galaxy’s goals against numbers were anomalous that year. 

Now I do not know if this jump in improvement is related more to tactics or personnel, since Beckham wasn't exactly the best defender, but I can say with much confidence that the Galaxy were simply a better defensive team post Beckham. 

Let’s dive into the data and look at goals against average.

As you can see above, the Galaxy’s goals against average has consistently been well below that of the conference for three of the four years.  The problem, however, is that the xGoals against data shows that the 2011 Galaxy’s numbers may be a bit of an outlier. From an xG standpoint, there is a very clear distinction between the Beckham and post Beckham years.  Take a look.

The very same thing can be said for shots against. 

Well what about shot leverage? That is, the positions of the field he Galaxy are giving up shots. Has that remained constant?

At first glance, yes, despite the varying levels of shot volume faced. 

Metric 2011 2012 2013 2014
Avg Shot Leverage against 0.095 0.104 0.09 0.093
Shots Against 408 439 326 348

The problem, however, is if you plot it against league averages, the Galaxy during the Beckham era were giving up shots of leverage consistent with the rest of the league. Over a four year span, shot leverage has climbed league wide, however, in the post Beckham years, the average shot leverage given up by the Galaxy was in decline.

The Beckham years saw a very defensively oriented Galaxy team. Ironically, however, it is the post Beckham years that have yielded the best defensive numbers (ignoring the anomalous goals against totals of 2011 for the reasons shown above.)

This is in large part thanks to the staggering decrease in the number of shots the Galaxy give up. Now some of this probably correlates to possession, however, if you look at the Goals 3.0 table, you’ll find that possession is a poor corollary to shots against. In fact, there isn't a stat listed on that page that isn't.

Now, perhaps buried deep in the numbers is a great explanation as to why certain teams are so good at limiting shots, however, I would postulate that it is in large part tactical and linked to how many men you have tracking back.

If I am correct in this assumption, then I feel that the Galaxy will continue to dominate MLS in terms of giving up the least number of shots next year, at least until the arrival of Gerrard, as their shape and general personnel make up hasn't changed. Yes they lost Marcelo Sarvas, but Baggio Husidic is a player who tracks back just as much and makes as many tackles.

Of course, when Gerrard arrives, it’s anybody’s guess how the Galaxy will utilize him. Bruce has stated that he wants him closer to goal, which seems to rule out the possibility that we see Gerrard play in the role of deep-lying playmaker which we saw David Beckham play so well. This could suggest that the Galaxy’s xGA numbers will not rise above the totals we saw in the Beckham years, and the same can probably be said for shots.

While Gerrard still has some legs in him and still averages about three defensive actions a game, his ability to get back into the Galaxy’s shape will probably be less than whoever it is he replaces in the lineup. This means that the Galaxy probably will give up more shots against per game after he arrives. This more than likely means higher xG against, and higher goals against, but again, not as high as the Beckham years.

In other words, the Galaxy data during the Gerard era may fall about halfway in-between the 2012 and 2013 numbers.   

Top 50 Total Shots Created: MLS Week 13

I've been terrible with trying to keep up with this quantitative metric, but I figured it wouldn't hurt to throw out an updated version in a vain attempt to try to play catch up with the status quo, being that the league is crawling towards the World Cup break. Really, the point of this exercise is to try and capture how often players are creating shots--not just for themselves, but for teammates. It's still pretty simplistic, and by no means the definitive answer to who the most valuable attackers are, but it's a start in moving away from basing value judgements on goal totals.

To be as clear as possible this is not a metric that measures quality or success of the shot. It's purely about opportunities to score. Either by way of putting mates* in position to score through passes that lead to shots--key passes--or to create a shot by himself--assisted or not--are the ways I count shots created.

*Editor loves word choice.

One thing I did do to include the best available and least luck-influenced player was to set a threshold of 700 minutes played. That limit was arbitrary and selected merely based upon the results of compiling the list. For that reason, and no other, you won't see individuals such as Michael Bradley, Gilberto, Brad Davis, Joao Plata, Marco Di Vaio and Kekuta Manneh on this list even though their shot creation rates merited a position in the top 50. I am very high on both Plata and Manneh, and I would love to see both surpass the 600-minute mark and really fly beyond 2,000 minutes this season so we can see what their stable versions look like.

50-33:  The Above Average

RankNameClubPositionMinutesKey PassesAssistsShotsShCShC/90

50Blas PerezDallasFWD8996224323.20

49Nick DeLeonDCMF102612223373.25

48Vincent NogueiraPhiladelphiaMF134817230493.27

47JuninhoLAMF9629323353.27

46Benny FeilhaberKCMF126026317463.29

45Erick TorresChivasFWD11868137463.49

44Jack McInerneryMontrealFWD84411121333.52

43Baggio HusidićLAMF76113116303.55

42Dillion PowersColoradoMF8252139333.60

41Lamar NeagleSeattleMF98710228403.65

40Teal BunburyNEFWD117015330483.69

39Felipe MartinsMontrealMF99615224413.70

38Jairo ArrietaColumbusFWD8189025343.74

37Max UrrutiPortlandFWD7445026313.75

36Justin MappMontrealMF94917419403.79

35Travis IshizakiLAMF73520110313.80

34Andrew WengerPhiladelphiaFWD101211131433.82

33Diego FagundezNEMF10868237473.90

I'll admit there is quite a bit of disparity between Diego Fagundez (#33) and Nick DeLeon (#49). This group does however hold a few names seems that, to my mind, seem to fit together. Blas Perez (#50), Erick Torres (#45), Jack McInerney (#44) and Andrew Wenger (#34) all are viewed a bit differently in terms of success, but, again, this isn't about results-based productivity so much as process-based productivity. We're merely looking at how much they're involved in creating goal scoring chances, regardless of the quality of those chances or where they are located. In that context it makes more sense.

The lone surprise for me in this tier is Justin Mapp. I would have assumed he'd be much higher on this list being that he's been on the few bright spots for Montreal a long with JackMac.


32-10:  The Good.

RankNameClubPositionMinutesKey PassesAssistsShotsShCShC/90

32Chris WondolowskiSan JoseFWD8106030364.00

31Obafemi MartinsSeattleFWD124619631564.04

30MichelDallasMF74014218344.14

29Lee NguyenNEMF103224024484.19

28B. Wright-PhillipsNYRBFWD10518041494.20

27Edson BuddleColoradoFWD70710122334.20

26Shea SalinasSan JoseMF9163247434.22

25Sabastian FernandezVancouverFWD65410021314.27

24Will BruinHoustonFWD122120137584.28

23Graham ZusiKCFWD79424311384.31

22Alvaro SaborioReal Salt LakeFWD8695235424.35

21Leonardo FernandezPhiladelphiaFWD70113120344.37

20Giles BarnesHoustonFWD133512251654.38

19Gaston FernandezPortlandFWD75719018374.40

18Mike MageeChicagoFWD7149224354.41

17Harry ShippChicagoFWD89423417444.43

16Marco PappaSeattleMF75112124374.43

15Mauro DiazDallasMF64616214324.46

14Bernando AnorColumbusMF71811025364.51

13Cristian MaidanaPhiladelphiaMF87123220454.65

12Quincy AmarikwaChicagoFWD88015428474.81

11Dom DwyerKCFWD10507050574.89

10Deshorn BrownColoradoFWD9026043494.89

Two other names that are notable here. Edson Buddle (#27)--whom everyone thought was done two years ago when he was traded to Colorado--and Marco Pappa (#16), who was kind of a last minute signing before the start of the season, and who was a serious question mark considering his lack of playing time in the Netherlands.  Now both of these individuals that were stamped as likely non-essentials are two of most involved in the creation of their clubs attack. Lee Nguyen (29) coming in higher than Obafemi Martins (31) makes me laugh, simply because Martins is second in the league in assists and most people still hold that to being the truest or, perhaps, the most obvious sign of team goal contributions. Yet Nguyen has been a catalyst for New England and is simply their most valuable player when it comes to finding the ability to create chances. This is the meat and potatoes of the list.

9-4: The Elite.

RankNameClubPositionMinutesKey PassesAssistsShotsShCShC/90

9Javier MoralesReal Salt LakeMF115441521675.23

8Fabian EspindolaDCFWD108630430645.30

7Diego ValeriPortlandMF111728537705.64

6Landon DonovanLAMF80224225515.72

5Thierry HenryNYRBFWD117023449765.85

4Federico HiguainColumbusFWD108039527715.92

So there that is. There shouldn't be any argument here with any of these names. Fabian Espindola (#8) is the sole reason DC even has a shot at the playoffs. He is going to get every opportunity to be 'the man' in black and red. Landon Donovan (#6) despite his uncanny snubbery from the US National Team is still clearly a major factor for the Galaxy and their attack. Sticking with the theme of decline in skills, Thierry Henry (#5) is still one of the greatest to ever play in MLS.

Oh, and I'm just biding my time for Higuian to get past this "slump" and jet into the MVP Candidate category... because that's simply where he belongs. More on that down the road.

3-1:  The MVP Candidates.

RankNameClubPositionMinutesKey PassesAssistsShotsShCShC/90

3Robbie KeaneLAFWD99019245666.00

2Clint DempseySeattleMF75114243597.07

1Pedro MoralesWhitecapsMF82131438738.00

Clint Dempsey (#2) has had the kind of year that is simply bananas. It's been so crazy that it's somehow eclipsed the Pedro Morales (#1) show that is going on just a few short hours north of him. Sure, these guys take penalty kicks, but that's only a small fraction of their shots generated. If these two take this same show into the later stages of the season I can't think there would be much reason to consider anyone else for MVP.

Oh, I guess you could probably throw Robbie Keane's (#3) name in that list, too. People forget about ol' faithful, but even without his P.I.C. (read: 'Partner in Crime' for those that aren't as hip as I am) for a game or two here and there, he's still been incredible. Currently he ranks third in individual expected goals, proving that he also finds dangerous places to take his shots and doesn't hesitate to pull the trigger. Oh, and despite the angry looks and words AND finger wags, he gets his teammates those same opportunities.

And here's the Excel File for the top 50.

How it Happened: Week One

Hello friends. This is the first in what will hopefully be a weekly feature here at ASA by yours truly. First, the background: Not being a fan of any particular MLS team is hard. It's hard to follow an entire league of 19 teams. Seven or eight games a week are difficult to catch up on, even when they aren't all played at the same time. Previously, I've watched highlights and 'condensed games' to try to pick up which teams and players were playing well, but it just doesn't work. The only way to really learn a team's strengths, weaknesses and tendencies is by watching every minute of every game they play. There's no way I can do that with every team in MLS while still working a full-time job. Sorry.

My solution is this: I plan on committing to watching a full 90 minutes of three games per week. This gives me six teams that I'll feel that I truly know (at least for that week), and should certainly teach me a heckuva lot more than just if I just watched their highlight packages. Since this here is an analytical and statistic-focused blog, I'll break down each of the three games by one particular stat or Opta chalkboard image that I think told the story of the game for each team. Think this idea is idiotic? Love it? Please, let me know: feedback is always appreciated. But leave my mom out of this.

DC United vs. Columbus Crew

Stat that told the story for Columbus: 58% of successful passes in attacking half for the fullbacks

clb1

The above image is all of the completed passes for Crew fullbacks Waylon Francis and Josh Williams on Saturday. These two players are clearly defenders who aren't afraid to get forward, but the startling frequency with which they were able to get up the field against DC had to have alarm bells ringing for United fans. For folks who prefer numbers to images, here you are: 49 of the 85 passes that Francis and Williams completed (58%) were in the attacking half. That's a pretty solid attacking contribution from two guys who are listed along the back line.

This was made possible for Columbus by a couple of adjustments made by new coach Gregg Berhalter. Centerbacks Michael Parkhurst and Giancarlo Gonzalez split reallllly wide when in possession, allowing both fullbacks to get forward. This was made possible by holding midfielder Wil Trapp, who sat very deep to cover the gap between centerbacks. It's only one game, but it certainly looked like a good strategy in week one for Columbus.

Stat that told the story for DC: 1 attacking player's pass into the penalty area

dcu1

Really, the above image for Columbus tells a lot of the story for DC, as well: they got hammered because the Crew got the ball wide and stretched DC's shape like a bad hamstring. With a team full of new faces who clearly haven't learned to play with one another yet, the defense was abused by all the space Crew players were able to find. But I can't use the same stat for both teams, so here's what I got for United: one. One successful pass from any of the three players nominally deployed in attack (Eddie Johnson, Fabian Espindola, Luis Silva) that ended in the penalty box.

Seriously: take a look at the Opta Chalkboard above. I get that it's hard to complete passes in the 18, but for the three guys who are tasked with creating chances, there needs to be more than one completed pass that ends up there. Oh, and that one completed pass? It came from a free kick, and ended with a flick-on by Davy Arnaud that didn't even turn into a shot. There was a lot wrong with DC in 2013 and a lot wrong with DC last weekend, but if the new faces of Johnson and Espindola were expected to cure all attacking ills....Ben Olsen may be in for a rude awakening.

Portland Timbers vs. Philadelphia Union

Stat that told the story for Portland: 20 crosses in the second hour of the game

The Timbers came out for the season opener and were dealt a dose of their own medicine from the new-look Philadelphia Union. Playing in a 4-3-3, the Union clogged the center of the field, put a lot of pressure on Portland and really made it difficult for the home team to get into their possession game. But as any good team does, the Timbers made adjustments. After being credited with just two crosses from open play in the games first 35 minutes, Portland emphasized wide play with Michael Harrington getting forward and Darlington Nagbe flaring out wide. After the 35th minute, Opta credited Portland with 20 crosses from open play. Some of this was due to bombing the ball forward as they sought an equalizer late, but recording 10 times as many crosses was certainly the product of an adjustment made by the Timbers.

Stat that told the story for Philadelphia: 12 midfield interceptions & recoveries to start the game

As I said above, the Union started the game very strong, with their midfield really clogging up Portland's attempts to possess the ball. The midfield three of Maurice Edu, Brian Carroll and Vincent Nogueira seemed to be replicating some of what made Portland so successful in 2013: clogging the middle of the field and winning a majority of loose balls. Opta credits those three with 12 combined interceptions and recoveries in the game's first 22 minutes. However, as also noted above, Portland adjusted to the Union's set-up and began to emphasize wide play. The Union didn't really adjust to the adjustment, as the Timbers clearly became more and more comfortable as the game went on. After those 12 interceptions/recoveries in the first 22 minutes, Edu, Carroll and Nogueria only recorded seven more the rest of the game.

LA Galaxy vs. Real Salt Lake

Stat that told the story for LA: 2.39 expected goals; 0 actual goals

lag1

If you're at this site, chances are you know the concept behind expected goals. If not, scroll down a ways and read up. Anyway, look at the above image: that's not a map of shots that typically leads to a shutout. According to the numbers run by ASA's own Harrison Crow, a league average team would've finished 2.39 goals from those shots. They finished zero. If you aren't into the stats and would prefer the English commentator's version: Robbie Keane missed some sitters, Landon Donovan was unlucky not to finish any of his half-chances, and Juninho and Marcelo Sarvas combined for some speculative efforts that nearly bulged the ol' onion bag. Oh, and Nick Rimando had a magisterial day in net to keep his clean sheet.

Stat that told the story for RSL: Joao Plata's complete game

I'm cheating a little here because that's not a real stat, but any time there's a 1-0 game, it's tough to leave out any conversation about the lone goal scorer. In this case, that's the diminutive Ecuadorian, Joao Plata. Plata debuted for Toronto FC three seasons ago, and it seems like he's been around for a lot longer than your average 22-year-old. But it's true. Plata is only 22, and if Saturday night is any indication, he could be in for his best season in MLS yet. Not only was Plata's finish on the game's only goal very cool, he was consistently playing with a lot more tactical awareness than I've seen out of him in the past. Whether it was setting up Alvaro Saborio for golden chances or making intelligent runs to stretch the defense and open up space for Javier Morales, Plata had a very, very good game against LA.

MLS Possession with Purpose Week 1: The best (and worst) performances

Greetings one and all as the new season begins in MLS. In case you missed it I published an article on here not to long ago that dives into my Possession with Purpose Indices to include a general introduction on what it is and means as well as some explanations behind the Indices. If you haven't gone through the article before or if you need a refresh click here.

Here's how the teams fared, compared to each other, in Possession with Purpose Week #1:

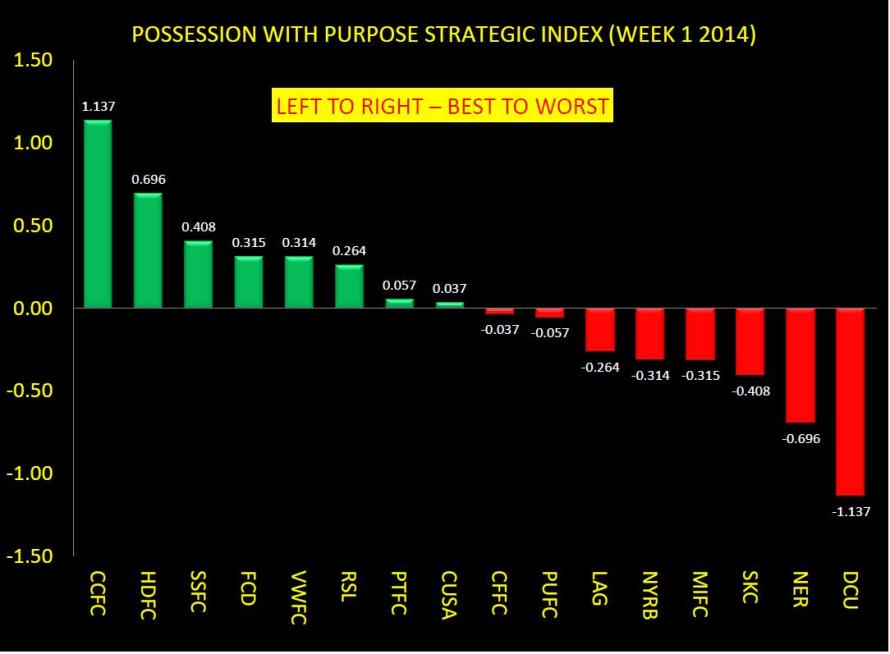
POSSESSION WITH PURPOSE STRATEGIC COMPOSITE INDEX WEEK 1 RESULTS

Observations:

This Index is not influenced by previous season results; it's a new year and a fresh/clean slate for teams to build from as they all challenge each other to make the Playoffs. So all you supporters of teams that didn't do so well this past year - fahgetaboutit!

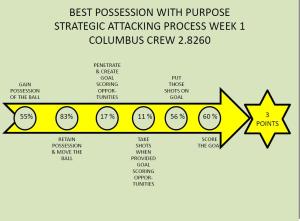
Next thing to consider is that positive numbers indicate the team performed better in attack and defense than their opponent - in looking at the diagram note that Columbus is at the far left while their opponent is on the far right.  As the season unfolds these overall positions should change.  As noted Columbus had the best overall attack compared to all other teams this past week; here are their percentages in the six steps of PWP:

BEST PWP RESULTS FOR WEEK 1 IN MLS - COLUMBUS CREW

Another top performer was Houston - some consider, last year, they were a sleeping giant that simply didn't wake up in time for a solid Playoff run - I do - in their first game this year they burst the flood gates with 4 goals and some solid and superb defense led by a guy I absolutely hated to see leave Portland - David Horst.

Some may gaffaw at this but this time last year - before his injury - I thought David had a superb chance to get a wee bit stuck in (some minutes) on some USMNT training like Michael Harrington did this off-season.

I still think David has great pedigree as a stand-up defender with great timing and good vision to see gaps and create gaps. So if you are a Houston supporter know that I have a special interest in seeing David do great things.

As for reading the diagram - there's a note there to read it from left to right (best to worst). The composite Index is the difference between the team Attacking PWP Index and the team Defending PWP Index. The overall total represents the ratios of success each team had in performing the six basic steps, possession, passing accuracy, penetration, creation, targeting, and scoring a goal. It's not perfect but last year it was very representative.

Before getting to the other PWP Indices...

This is the first week and like most things that are measured, to begin with, there may be wide variation in the first 10 or so samples analyzed - so like last year Chivas began with a good start.

Does that continue or do we see them tail off - likewise - DC United ended the season near bottom in almost every single PWP category - so far they are right where they left off. Will time show that Eddie Johnson was a good purchase - we'll see.

As for the leaders from last year like Real Salt Lake, Sporting KC and Portland. It's no secret now that RSL opened up with a solid three points away to LA Galaxy - is it rude to expect that Robbie Keane will miss another penalty shot this year?

How about that torrential downpour in Portland - rain is not unusual for that part of the country - does it rain a bit more on the Timbers this season or will the sun begin to shine as Fernandez, Valeri, Nagbe, Urutti and others really get there gears engaged with what many feel and think might be the most potent attacking system/scheme/player personnel package in the league?

In considering what Sporting KC has on their plate early in the season, 5 games in the course of 15 days I think - is it too much to expect that they will show early indication of dominance again?

In looking at the PWP Attacking Index here's how those teams rated:

PWP STRATEGIC ATTACKING INDEX WEEK 1 2014

Observations:

It's no secret that goals scored will heavily influence the outcome of a game - that's to be expected - so those teams that scored a brace or more of goals this early in the season will rate higher than some that didn't score as many goals.

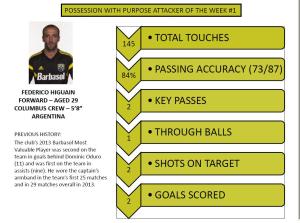
Another new feature this year will be a PWP Attacking and Defending Player of the Week - where some key individual statistics are highlighted that helped influence overall team performance.

For this past week the PWP Attacking Player of the Week is Federico Higuain.

PWP ATTACKER OF THE WEEK #1 2014

In looking at the PWP Defending Index here's how the teams fared:

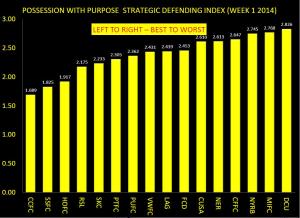
PWP STRATEGIC DEFENDING INDEX WEEK 1 2014

Observations:

Since this is the first week the top defending team also happens to be the top attacking team.

For each specific week (not cummulative) this will be the case - for me there is nothing wrong with that - it takes a solid defense to win games as well.

At the end of the season there might be a pattern on who's the top performer, week to week, that is influencing the outcomes of team performances better than others; we'll see.

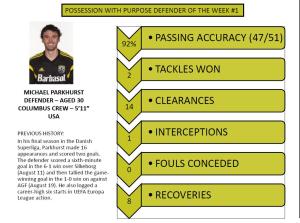
For this past week the PWP Defending Player of the Week is Michael Parkhurst.

PWP DEFENDER OF THE WEEK #1 2014

In closing...

As the season progresses (right around week 15 or so) I'd offer that the PWP Strategic Composite Index should help paint a picture/expectation on what teams are working towards making the Playoffs and what teams are the doormats.

By week 17 last year this Index had accurately predicted 8 of the top 10 teams to make the Playoffs and by seasons end this Index had offered up 9 of the top 10 teams to make the MLS Playoffs; exceeding, in accuracy/prediction both the Squawka.com and Whoscored.com Indices - hopefully that level of predictability shows up again this year.

A couple of housekeeping things - my first and foremost source for data remains, like last year, the MLS Chalkboard developed and provided by Opta. Second - as the year continues I will attempt to peel back some more detail on 'defending' by teams in the final third.

Not sure how that will go but know that in a few weeks time I should be able to offer some additional team defending performance indicators for all MLS teams...

All the best, Chris

A Week One Break Down Of Shot Locations, Final Third Passes and xGF

HEY EVERYONE, WE HAD A WEEK OF SOCCER! YAY! Taking a quick look at this ghetto chart that I made, we see a little break down of the shot locations as well as some of the final third possessions. I'm still searching for the best way to display this data, but there are some interesting things here. For instance, I feel a lot less silly about starting Robbie Keane on my fantasy team after a quick look at the Galaxy's xGF, as he really should have scored at least one goal from the run of play--oh and then there is the whole business of missing the penalty kick. Besides that, we can also see that New York Red Bulls were forced into long range shots and couldn't dangerously penetrate the 18-yard box despite being one of three clubs with more than 100 touches inside the attacking third.

Team Att1 xG1 Att2 xG2 Att3 xG3 Att4 xG4 Att5 xG5 Att6 xG6 xGF Passes Completed  Total Passes AP%
Sounders 0 0 0 0 2 0.142 7 0.371 0 0 0 0 0.513 57 102 0.559
Sporting 0 0 2 0.354 3 0.213 3 0.159 1 0.023 0 0 0.749 45 86 0.523
Chivas 0 0 4 0.708 2 0.142 4 0.212 0 0 0 0 1.062 88 137 0.642
Fire 0 0 0 0 1 0.071 4 0.212 0 0 0 0 0.283 58 85 0.682
Galaxy 0 0 8 1.416 4 0.284 13 0.689 0 0 0 0 2.389 116 147 0.789
RSL 0 0 4 0.708 1 0.071 3 0.159 0 0 0 0 0.938 75 104 0.721
Timbers 0 0 6 1.062 1 0.071 5 0.265 0 0 1 0.035 1.433 106 154 0.688
Union 0 0 2 0.354 2 0.142 4 0.212 0 0 0 0 0.708 68 105 0.648
Dynamo 0 0 10 1.77 2 0.142 6 0.318 0 0 0 0 2.23 70 105 0.667
Revolution 0 0 5 0.885 3 0.213 6 0.318 1 0.023 1 0.035 1.474 60 103 0.583
FC Dallas 0 0 3 0.531 4 0.284 4 0.212 0 0 0 0 1.027 81 115 0.704
Impact 0 0 7 1.239 1 0.071 6 0.318 0 0 0 0 1.628 60 107 0.561
Whitecaps 0 0 5 0.885 3 0.213 6 0.318 0 0 0 0 1.416 86 125 0.688
NYRB 0 0 1 0.177 1 0.071 5 0.265 0 0 0 0 0.513 100 139 0.719
DC United 0 0 6 1.062 0 0 3 0.159 1 0.023 0 0 1.244 80 119 0.672
Crew 0 0 4 0.708 0 0 4 0.212 1 0.023 0 0 0.943 74 104 0.712
Total 0 0 67 11.859 30 2.13 83 4.399 4 0.092 2 0.07 18.55 1224 1837 0.666

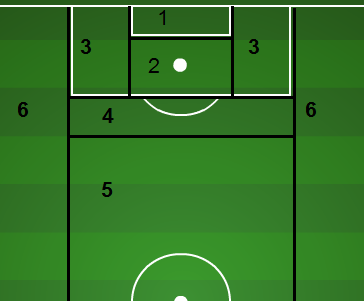
Scoring ZonesZones 1-6 have been broken down by Matthias previously, and correspond to the map displayed on the right. xGF is simply expected goals for, and AP% is simply attacking passing percentage.

Looking at the xGF, shot location would predict approximately 18-19 goals being scored when in reality there were 26 total goals put through the back of the net. The shot locations were compiled using mlssoccer.com's Golazo and I'm not sure that the locations were entirely accurate. I plan on doing a bit of a look into how the break down works in regards to Goalzo versus the Chalkboard, and I really think that the use of the chalkboard will yield better prediction numbers, but that's purely a suspicion of mine.

Overall it'll be interesting to monitor this break down, and with that, maybe next time I'll do an xGD where teams could project how many "points" that they should have based on whether or not they should have won, drawn or lost a match. Taking that a step further it'll be interesting to see if the first 17 games has any insight to the next 17 games of the season. Here we go!

Season Preview: LA Galaxy

There are few clubs in MLS that are affiliated with distinct "eras." In L.A., you've got Cobi Jones, Alexi Lalas, Carlos Ruiz, Landon Donovan, David Beckham and Robbie Keane. A team that has finished first in the Western Conference eight times and only missed the playoffs in three of 17 seasons. The Galaxy are the diamonds of MLS, the staple of the league, and the example of sustained success in this country when it comes to soccer. Think Boston Celtics, LA Lakers, New York Yankees, Green Bay Packers and so forth. The LA Galaxy have had the success, the names, and the lineage to be known as one of MLS' first "Superclubs."* LAG-XI

Roster Churn: The Galaxy return 73.1% of their 2013 minutes played (5th in the East, 11th in MLS)

2014 Preview

lag-rosterIII'm not going to lie. The 2013 LA Galaxy we're pretty much boring. Typically one of the top goal scoring clubs, their ability to squash shots before they happen was as important last yearlainfo as the offensive heroics. However, it's foreseeable that the goals against total should have been low, and will be again in 2014.  Not only did LA limit the shot totals, they also did a heckuva job limiting the positions in which their opponents were firing those shots. The Galaxy finished second behind Sporting Kansas City in expected goals allowed last season.

Unfortunately, for most of the year it was Carlo Cudicini who seemingly made mistake after mistake that led to inopportune goals and limited the point total. Sure, it's a convenient narrative to put it all on one person, but blaming the Galaxy's slow starts has merit, and consider the fact that the club played an excess of 48 regular season, post-season, US Open Cup, Champions League and other games during the season (most in MLS). It led to a busy nine months, and very likely thinned the club that already was reduced to bare bones at times.

Fast forward to this off-season; big names have often become synonymous with L.A., as the they have been the team that sets the bar when it comes to spending money and acquiring talent...well  until Tim Leiweke moved to Toronto last summer. Leiweke, who masterminded David Beckham to  the states was the engineer behind Jermain Defoe to Canada this off-season. While Toronto became the big spenders this off-season, L.A. was forced to stand pat with all three of the designated players slots being filled and little available "extra" cash. That may have seemed to bother some people, but not Bruce Arena. Arena took advantage of the off-season to deepen his bench with veterans, raw youth talent  and an unknown from Brazil.

The Backline

Omar Gonzalez, whether you find him overrated or not, is the anchor to this defensive line. Despite the fact that there are still some holes to be filled, especially with the loss of Sean Franklin, the Galaxy took a huge step forward in reinforcing the defense with the discovery of Jaime Penedo last year.

Gonzalez will obviously miss some time with the US National team at the World Cup, so the big questions going forward are whether or not the club can manage the permanent loss of Franklin, and the temporary drop in talent from Gonzalez to whomever else wins that job in roughly the next 88 days. Not that anyone is counting. Even when Gonzo is around, the right outside fullback positions is still an apparent weaknesses, and considering they don't have much depth on the wings going forward, it would appear width could be an issue throughout the roster. I fully expect Todd Dunivant to continue his reign as an unspoken and underappreciated left back in this league.

The Midfield

Bruce Arena was quoted as saying that Landon Donovan will drop into the midfield and, conjecture on my behalf, probably take over the role of Hector Jimenez who has since been traded to Columbus. While this can provide some width, I suspect that he'll almost be seen as a third forward at times as he does get up the pitch and like to cut into the box on runs. Despite being 32, he may still be the top-scoring midfielder in MLS. The club does still have Robbie Rogers, but unfortunately his return to MLS has been rather disappointing, and he's been nowhere near the quality of Mike Magee, for whom he was traded last season.

The new international Baggio Husidić returns to MLS from the Swedish second division club Hammarby IF. A former cog in the 2009, 2010 and 2011 Chicago Fire, and a former Generation Adidas midfielder, Husidić is the hope behind the two top central midfield pair in MLS. The blues aren't just about the glitz and the flash, as additions over the last couple of years have displayed grit---a word notorious for its usage in American football, but appropriate here I think. Marcelo Sarvas and his team-mate/Brazilian countrymen Juninho efficiently rock 'n roll in the midfield, and have become what some people refer to as the Galaxy engine room, forcing turnovers and providing quick and smart passes outlets to the wings and up the pitch to create quick opportunities. Adding the Bosnian-American Husidić to that depth is nothing but a good thing at this point for a club that has youth but not much veteran depth.

The Forwards

What did you say about veteran depth?!? Well, let's talk Rob Friend! Friend, a Canadian international with 32 caps to his name, is coming to Hollywood fresh off his loan to 2. Bundesliga club 1860 München, where he put home five goals in 24 matches over the past season and change. It is currently unknown where Friend will fit in, though it will most likely be as a rotating element up front. With Donovan stationed on the left and Gyasi Zardes down the right, the Galaxy will look to Friend to help provide quality depth in the 18, and he may also see legitimate chances to start.

The unknown quantity here is Samuel, yes, ANOTHER undiscovered Brazilian talent found by the scouting staff down in South America. I would imagine that Samuel could be exactly the "right" partnership that Keane needs up top. Fast and versatile. Someone who can drop back into space as well as find the open pockets of space behind the defense that Robbie Keane creates.

And, oh yeah!, Robbie Keane returns for yet another season? Oh, what's that? You can't wait until the end of the year when his contract's up? Well, tough luck. The runner up for 2013 MLS MVP  just signed a two-year extension that will essentially guarantee that he'll still have a Galaxy crest on his chest when eating those senior citizen dinners at Denny's before suiting up on to make your club look stupid.

As someone who loves his deep Irish lineage, I get a bit embarrassed at the thought of Robbie Keane being pretty much the most iconic player from my homeland. Still, I'm unabashedly proud at the incredible things that he does and how he backs up the intense ferocity on the pitch. His 0.64 goals per game since arriving in MLS two years ago is actually the highest goal scoring rate in the league over that period, just edging out Chris Wondolowski at 0.62 goals per game. Our Expected Goals 2.0 data also suggests that Keane scored more than twice as many goals as one would expect from an average player taking the same shots he took. That's good for second in MLS among players with at least 50 shots.

Conclusions

While LA might have taken a slight step back at different points over the last few years, and while they quietly were put down against RSL in the playoffs last November, it's safe to say that Bruce Arena has yet to lose his Midas Touch. The Galaxy are going to be a dominant force next year, one might actually consider LA a quiet contender for the MLS cup. With the flashiness of Seattle, the pop turn of Portland, as well as Kansas City's defensive dominance and New York's offensive juggernaut, L.A. might be playing from the shadows a bit more than usual this season. It would still be surprising for them to finish anywhere outside the top-3 in the Western Conference, and inconceivable for them not to make the playoffs. This is a year that should continue their Yankees-like reign over silverware, and the dominance they've displayed over their three decades of existence will be on full display.

Crowdsourcing Results

A plurality of ASA readers picked the Galaxy to finish second in the West this season (134 of 406 votes; 33%), and an overwhelming majority believe they will make the playoffs in some capacity (384 votes; 94.5%).

*Drew can teach you how to say "Superclub" at minute mark 15:58

A Closer Look At The MLS MVP Race

Editor's Note: This was the first of many articles by Jacob, who can be found at @MLSAtheist on twitter. It's quite amazing, and I encourage you to read it. He's one of several wonderful writers that we are adding to the site in the coming weeks. Please give him a follow and good feedback, as you have for Drew, Matty, and me. This is all part of putting together newer, better site content.

Not long ago, I saw a piece on ESPN handicapping the MLS MVP race, featuring the one and only Alexi Lalas. Say what you will about Lalas, but what he said on this topic got my mind jogging. The season was still a couple weeks from being complete, but the Redhead tipped Marco Di Vaio over Mike Magee for the award, based mostly on his higher goal total. He explained that goals are the rarest and most important event in soccer, so the guy who scores the most (and in the most games, giving his team a better chance to win) is the best candidate for the award. But here at American Soccer Analysis, we know that just because a guy puts the final touch on a goal doesn’t necessarily make him the most valuable component of that play, let alone that season.

Anyway, Lalas had a point: goals are important. And whether you like it or not, goal scorers and creators are always going to be the award winners in this sport. But still, looking solely at goal totals seems far too simplistic when handicapping the race for MVP. So, as we are wont to do around here, I tried to delve a little deeper.

First of all, you can contribute to goals without being the one to actually kick it into the net. I’ll do the most obvious thing possible, and just add assists to the equation. Additionally, not every player gets to play the same amount. Especially in MLS, where some of the top players are constantly called away for international duty, some MVP candidates only play in two-thirds of his team’s games. But if the premise here is that the award is intended to go to the most prolific goal creator, we should really look at how many goals they create when they’re actually on the field.

Here are the ten top MVP candidates (I know they probably aren’t all that deserving, but ten is a good round number and I’m a little OCD), and how many goals they’ve created, as well as their per 90 minute rate.

Player

Goals

Assists

G+A Per 90

M. Magee

21

4

.806

M. Di Vaio

20

2

.698

R. Keane

16

11

1.22

J. Morales

8

10

.710

Camilo

22

6

1.04

D. Valeri

10

13

.909

F. Higuain

11

9

.694

D. Fagundez

13

7

.742

T. Cahill

11

5

.642

G. Zusi

6

8

.535

It’s no surprise to see Keane and Camilo leading the way with over one per game, as they have the highest sum of goals and assists, and Keane did his work in fairly limited minutes. But again, goals and assists are a little too superficial for us here at ASA. After all, some goals are the fault of terrible defending, goalkeeping, or just some really fortunate bounces; instead it’s preferred to look at chance creation. If a player is consistently creating chances, it’s nearly inevitable that it should lead to more goals. Now rather than just the shots that actually end up in the net, we’ll run the numbers regarding shots, as well as passes that lead to shots (key passes) for the same players:

Player

Shots

Key Passes

Shots Created Per 90

M. Magee*

114

65

5.77

M. Di Vaio

89

25

3.62

R. Keane

54

53

4.86

J. Morales

33

94

5.01

Camilo

95

37

4.91

D. Valeri

55

59

4.51

F. Higuain

69

115

6.39

D. Fagundez

43

27

2.60

T. Cahill

47

19

2.65

G. Zusi

41

75

4.43

This time we’ve got a couple of different leaders, as Federico Higuain and Mike Magee take the lead thanks to their trigger-happy styles. Higuain’s incredible number of key passes, despite playing for a middling Crew team, should raise some eyebrows---the dude’s an absolutely fantastic attacker.

Still, I have an issue with just looking at shots created. After all, we know not all shots are created equal. Without looking up the shot location data of every one of the shots in the above table, I think there’s still a way to improve the statistics: add in a factor of accuracy.

For Higuain, creating over six shots a game is terrific. But from watching a lot of Columbus games, I can tell you that plenty of those shots were low percentage bombs from 30 yards out, and plenty of others were taken by other fairly inept Crew attackers. To try to factor this in, I’d like to look at how many shots on target each player creates - the ones that actually have a chance at becoming goals. While shots on goal stats for individual players are easy to find, it’s tougher to decipher when key passes lead to shots that test keepers rather than boots into the stands. To compensate, I used each player’s team percentage of shots on target to estimate how many key passes turned into shots on goal, leading to the final following table:

Player

Shots on Goal

Key Passes

Team Shot%

SoG Created Per 90

M. Magee*

50

65

48% / 51%

2.68

M. Di Vaio

56

25

54%

2.21

R. Keane

31

53

48%

2.56

J. Morales

19

94

52%

2.68

Camilo

56

37

49%

2.76

D. Valeri

31

59

49%

2.36

F. Higuain

36

115

43%

2.96

D. Fagundez

30

27

50%

1.57

T. Cahill

22

19

48%

1.25

G. Zusi

21

75

42%

2.00

There we have it. My endorsement for MVP this season, based on a combination of Alexi Lalas’ inspiration and my own twisted statistical mind, is Federico Higuain of the 16th-best team in the league, the Columbus Crew.

Just kidding, guys! Obviously the MVP debate should take more into account than who creates shots on goal. Defense, leadership, your team actually winning---all of these things should and do matter. But still, I think this was an interesting exercise and hopefully opened at least one set of eyes to how prolific Higuain is.

Finally, a few thoughts/takeaways in bullet form:

  • Higuain was held back by his team’s terrible shooting accuracy, but not as much as Graham Zusi. Now I understand why analytic folks like Sporting Kansas City’s chance creation so much, yet the team hasn’t always seen the results.
  • Diego Fagundez is incredibly selective about his shooting - almost 70% of his shots hit the target.
  • Javi Morales doesn’t shoot much for being so prolific at creating others shots. Reminds me of this post by Tempo Free Soccer---really interesting as far as categorizing attackers as shooters vs. providers.

*Since Magee was traded mid-season, his season total stats were harder to find. While I used Squawka for everyone else’s stats, I ended up having to tally Magee’s game-by-game stats from Who Scored. It’s possible that the two sites have different standards for what constitutes a shot or key pass, and that could’ve skewed the data for Magee. I’m not sure any of them look too far out of whack that I’m too suspicious, but it’s possible so I thought it should be noted.

MLS Attack Pairings

Today, I was asked simply, which team has the best pairing in MLS? It's a good question, and oddly one that I've been asked a lot and. Despite the frequency of requests, it's something that I have trouble answering. There are a lot of ways to measure performance for attacking personnel, but due to my time restraints I found the easiest way to do this was to go to Squawka and use their attack score. Below is a listing of teams and their two highest* attacking score combos. Since it's a purely cumulative stat I pro-rated it to 90 minutes. As you probably wouldn't be shocked to find out. Mike Magee, Landon Donovan and Federico Hinguian round out the top-3.

Player Team Minutes Attack Score AS per 90
Mike Magee Chicago 1051 582 50
Patrick Nyarko Chicago 1554 527 31
Carlos Alvarez Chivas USA 1653 360 20
Eric Avila Chivas USA 1634 260 14
Dillion Powers Colorado 2035 576 25
Deshorn Brown Colorado 1800 448 22
Federico Hinguian Columbus 2142 1162 49
Dominic Oduro Columbus 1987 610 28
Dwayne De Rosario DC United 1208 343 26
Kyle Porter DC United 1403 244 16
Blas Perez FC Dallas 1569 584 33
Michel FC Dallas 2004 538 24
Brad Davis Houston 1408 540 35
Will Bruin Houston 1721 472 25
Landon Donovan LA Galaxy 1380 753 49
Robbie Keane LA Galaxy 1320 698 48
Marco Di Vaio Montreal 1868 897 43
Felipe Martins Montreal 1768 535 27
Diego Fagundez New England 1621 613 34
Lee Nguyen New England 2137 527 22
Thierry Henry New York 1952 854 39
Tim Cahill New York 1761 441 23
Sabastian Le Toux Philadelphia 1864 729 35
Conor Casey Philadelphia 1528 667 39
Darlington Nagbe Portland 1895 761 36
Diego Valeri Portland 2072 725 31
Javier Morales RSL 1796 838 42
Ned Grabavoy RSL 2043 467 21
Chris Wondolowski San Jose 1890 530 25
Shea Salinas San Jose 1400 434 28
Eddie Johnson Seattle 1300 461 32
Obafemi Martins Seattle 1024 448 39
Graham Zusi Sporting KC 1860 680 33
Claudio Bieler Sporting KC 1986 620 28
Jonathan Osorio Toronto FC 1164 397 31
Robert Earnshaw Toronto FC 1495 333 20
Camilo Sanvezzo Vancouver 1674 876 47
Kenny Miller Vancouver 1305 506 35

There are a couple of key individuals missing from this list that may or may not "pop out" at you. The first is Philadelphia's top goal scorer Jack McInereny. Part of this is due to his missing time with the Mens National Team during the early rounds of the Gold Cup tournament. The other part is that outside of his bunches of goals scored early in the season he hasn't done much else with his time.

The other name, though less likely to be spotted, is Luis Silva. Since arriving at DC United, he's posted the top overall score determined by Squawka, as well as the highest rating on Whoscored, with his new club. However, he's only played 5 games and a total of 420 minutes for DCU, so it's a small sample and I decided to drop him from the listing. This lowered DC United's end score rather dramatically and yet corresponds quite well with whatever combination player they might be able to muster.

Now, taking all those dynamic duos and adding them together gave us a combined score of the two best attacking players on each team. Here are those in order.

AS per 90
LA Galaxy 97
Vancouver 82
Chicago 80
Crew 76
Philadelphia 74
Seattle 71
Montreal 70
Portland 68
RSL 63
New York 62
Sporting KC 61
Houston 59
FC Dallas 58
New England 56
San Jose 53
Toronto FC 51
Rapids 48
DC United 41
Chivas 34

It's not a surprise to see LA at the top of any such list. Robbie Keane and Donovan have long be herald as the best dynamic attacking duo of the league. But if you are looking beyond those two the teams are rather surprising. Vancouver, Chicago, Columbus and Philly all make up the top-5 with the often scrutinized Obafemi Martins and Eddie Johnson contributions falling just outside the grouping.

Another interesting note, taking us further towards the discussion of single best player. While individual performances matter, it's about team accomplishment rather than singular performances over the stretch of the season. It's obvious that while Chicago and Columbus both have had outstanding performances from their key men up top, they are lacking something on a team level such that these individual metrics don't correspond entirely to the tables at the end of the day.