

Breaking Goals Added
/Let’s Break g+!
As you may have noticed with this week’s rollout of goals added (g+) and the related articles, we at ASA are pretty fired up about our new possession xG framework and player valuation methodology. The journey to get to this point would best be documented by the thousands of messages in the ASA slack chat over the last 9 months, and something I want to highlight is that the exercise of putting together this model would have been worth it in and of itself for all involved even if nothing was ever published.
Every day during this period the staff have discussed the sport in footballing terms, tactical terms, data modeling techniques, and more, and critically, g+ is still not “finished” in the sense with that every new day brings a new controversy -- the staff is constantly pulling apart the fabric of the model and to an extent the sport itself as we work through questions and ideas. This is, on the one hand, an exceedingly frustrating exercise for everyone who has wanted to publish it, and on the other hand, it’s exhilarating because as the project we’ve been working towards remains under attack by its very creators every minute of the day, we continue to talk about soccer while most of the world does not here in the spring and early summer of 2020. Also, because of the multi-disciplinary background at the site, discussions might start within the football tactics realm, move to data science, bounce off a few scientific principles, some legal theory, then to double-entry journal entry accounting before they come back to scouting and player evaluation.
In this post, accepting as fact that the model grows every day and that we had to publish the first draft of it at some point, I wanted to talk first about some of the reasons we’re pretty sure the model works, some of the validation approaches we’ve taken (acknowledging there is much more work to come here), and then to identify some of the weak points remaining in the model, and possibly hint at some upcoming improvements.
Does g+ work?
Team Level Validations
One reason shot-based metrics came to prominence is that they are more predictive of future goal scoring than past goal scoring is predictive of future goal scoring. This largely comes down to sample size. Goals are rare, and so while goals are information-rich statistics, it takes quite some time to have observed enough about them to rely on them to predict future results. Because shots happen roughly 10 times more than goals, early on in a season if you’re trying to predict how teams will perform later in the season, shots do better than goals, and shot-based xG is basically an information-rich version of shots, so it’s a further improvement.
So, while the primary reason for creating g+ was not to have a better predictor of team results than xG but instead to create a comprehensive framework that maximizes the use of event data and xG to better inform us about player evaluation at all the positions and how football works (or doesn’t), it would still be great if whatever g+ model we come up with matched or improve on the predictiveness of traditional xG. And *wipes sweat off brow* sure enough, it does!
Below is a graph of how select observations of past metrics correlate with future points per game, which is mostly (but not entirely) the point of soccer. This is mostly in the classic 11tegen11 correlation curve setup:
Because the scheduling of home and away matches in the modern MLS provides additional complexities for these types of curves, with various expansion teams constructing new stadia during the first half of the season and therefore playing an unusual amount of games on the road for long stretches and then home for other stretches, we did some cosmetic work on these graphs. First, in an attempt to wipe out the home/away mismatches, we randomized the match days that form the season splits (past vs future observations) on the X axis and then took a composite of 1,000 such randomizations to generate these curves. The graph still compares how say the xG ratio of the first 10 matches correlates with the xG ratio of the remaining 24 matches, but the real life calendar timeline has been rebalanced.
The headline here is a good one. At a high level, g+ is more predictive of future PPG than xG, which is more predictive than shots, which is more predictive than goals, which is more predictive than past PPG. Goals added passes this test.
Here are some of the less traditional metrics featured in the charts above:
A team’s “g+ ratio” is its total g+ in a game divided by the sum of its g+ and its opponent’s g+.
A team’s “max g+ ratio” is the total of the max g+ moment of each of the possessions for a team divided by the sum of this total for both teams
A team’s “penultimate g+ ratio” is the total of the second to last g+ moment of each of the possessions for a team divided by the sum of this total for both teams (the purpose of this was to delete out all of the xG signal from shots and see if the correlation remained high – it did).
A team’s “Completed passes into area in front of the box ratio” is the total passes a team completes into the areas shaded below in a game divided by the total passes each team completes into these areas:
The g+ model does, in fact, capture the value of passes into these dangerous areas, but I showed this one separately above because the raw metric itself does not carry with it any explicit expected goal chain components or g+ information within it -- in fact, the number is “ignorant” of all shots and of all activity in the penalty boxes of both teams -- and yet it beats traditional xG and most other metrics in terms of predicting future results in MLS.
We will return to this point below discussing a potential weak point in the model.
Specific Action Validations
Nicolas Lodeiro
Another interesting way to validate the model is to use real-life examples of footballing actions and compare the eye test to the model outputs and then basically fight about it. John Muller orchestrated this grand adventure by bullying us to watch Nico Lodeiro for 90 straight minutes in the middle of the night and annotate his best and worst 10 moments. John has already published a summary of this experiment here. It’s quite good, and the results are mostly good news for the g+ model as well. As a side note, I would also just advocate for everyone reading this to every now and then do a “close-viewing” of a single game focusing in on a single player. It was torturous at times, yes, but on the whole a joyful experience. It’s good medicine for all soccer fans, not just analytics people.
Thom Test
Another way to try to break/test models is to evaluate quasi-theoretical examples. Thom Lawrence spoke of one such example in his must-watch StatsBomb talk on EPV models “Some things aren’t shots.” He pointed to the mostly heterodox kickoff tactic of launching a ball from the center circle down to the corner flag for an opposition throw-in, and identified that the tactical reason for doing so – not unlike a punt to change field position in other football sports – is an implicit calculation as to the likelihood of your team scoring first when in possession of the ball after kickoff compared to the likelihood of your team scoring first when the opposition has a throw-in by their own corner flag. Below you can see under the hood of the g+ model, the expected value of attempting a pass by compared to the expected value of your opponent attempting a throw-in by location (own goal on the left, opponent’s goal on right):

The g+ model handles this scenario well enough. You could say it passes the “Thom test.” In 2019, the average kickoff pass that was played backwards into the center of midfield (a typical kickoff) was evaluated by the model with a pre-action value of basically a flat zero (both teams equally likely to score over the next pair of possessions) and a resulting average action value with a goals added of -0.002, and while I did not have a pure play kickoff to corner flag action to use from 2019, there were a couple of failed passes in the opening seconds of matches from the central area of the pitch that went out for throw-ins near the opponents’ corner flags (both by Toronto players Bradley and Fraser hmm..), and the model rates these failed passes with a goals added of somewhere around +0.003, the passes themselves effectively giving up the full 1.4% probability of scoring on the terminated possession but… like a phoenix of extremely marginal gains, in its ashes arises a new game state in which over the course of 2 possessions, the team now throwing the ball in by their own corner flag has the worst of it (the kickoff team has also swapped the chance of their opponent scoring on the next possession at kickoff with a new chance of their opponent scoring beginning in their opponent’s final third!). I believe this captures the essence of the aforementioned “on-side kick”-like tactic and trade-off. Test passed. Like all things, the framework is itself not enough proof to advocate for this tactical trade-off as an optimal strategy. To turn the extremely small marginal gain into something worth putting thought into, you probably need a dedicated strategy to achieve an above-average result in making this trade-off.
But examples like these show again what this model does in its bones – calculates the expected probability of scoring on the current possession minus the probability of the opponent scoring on their next possession, then assigns values upwards and downwards to all actions that change these probabilities. In this example, a 2-possession time horizon seems to do the trick and at least directionally sets up the boundaries pretty well around debates over field position switches like this.
Player Level Validation
A lot of the validation work contemplated above takes place at the individual action level (checking to see if the model is making sense based on our understanding of how the sport works), or at a much more macro level (how does g+ do at predicting future performance), but one of the main goals was to end up with a metric with which to value individual players. Beyond the fancy modeling there is basic allocation math that takes place to attribute the modeled action values onto players and from there, to the fun stuff of forming lists of players and fighting over them.
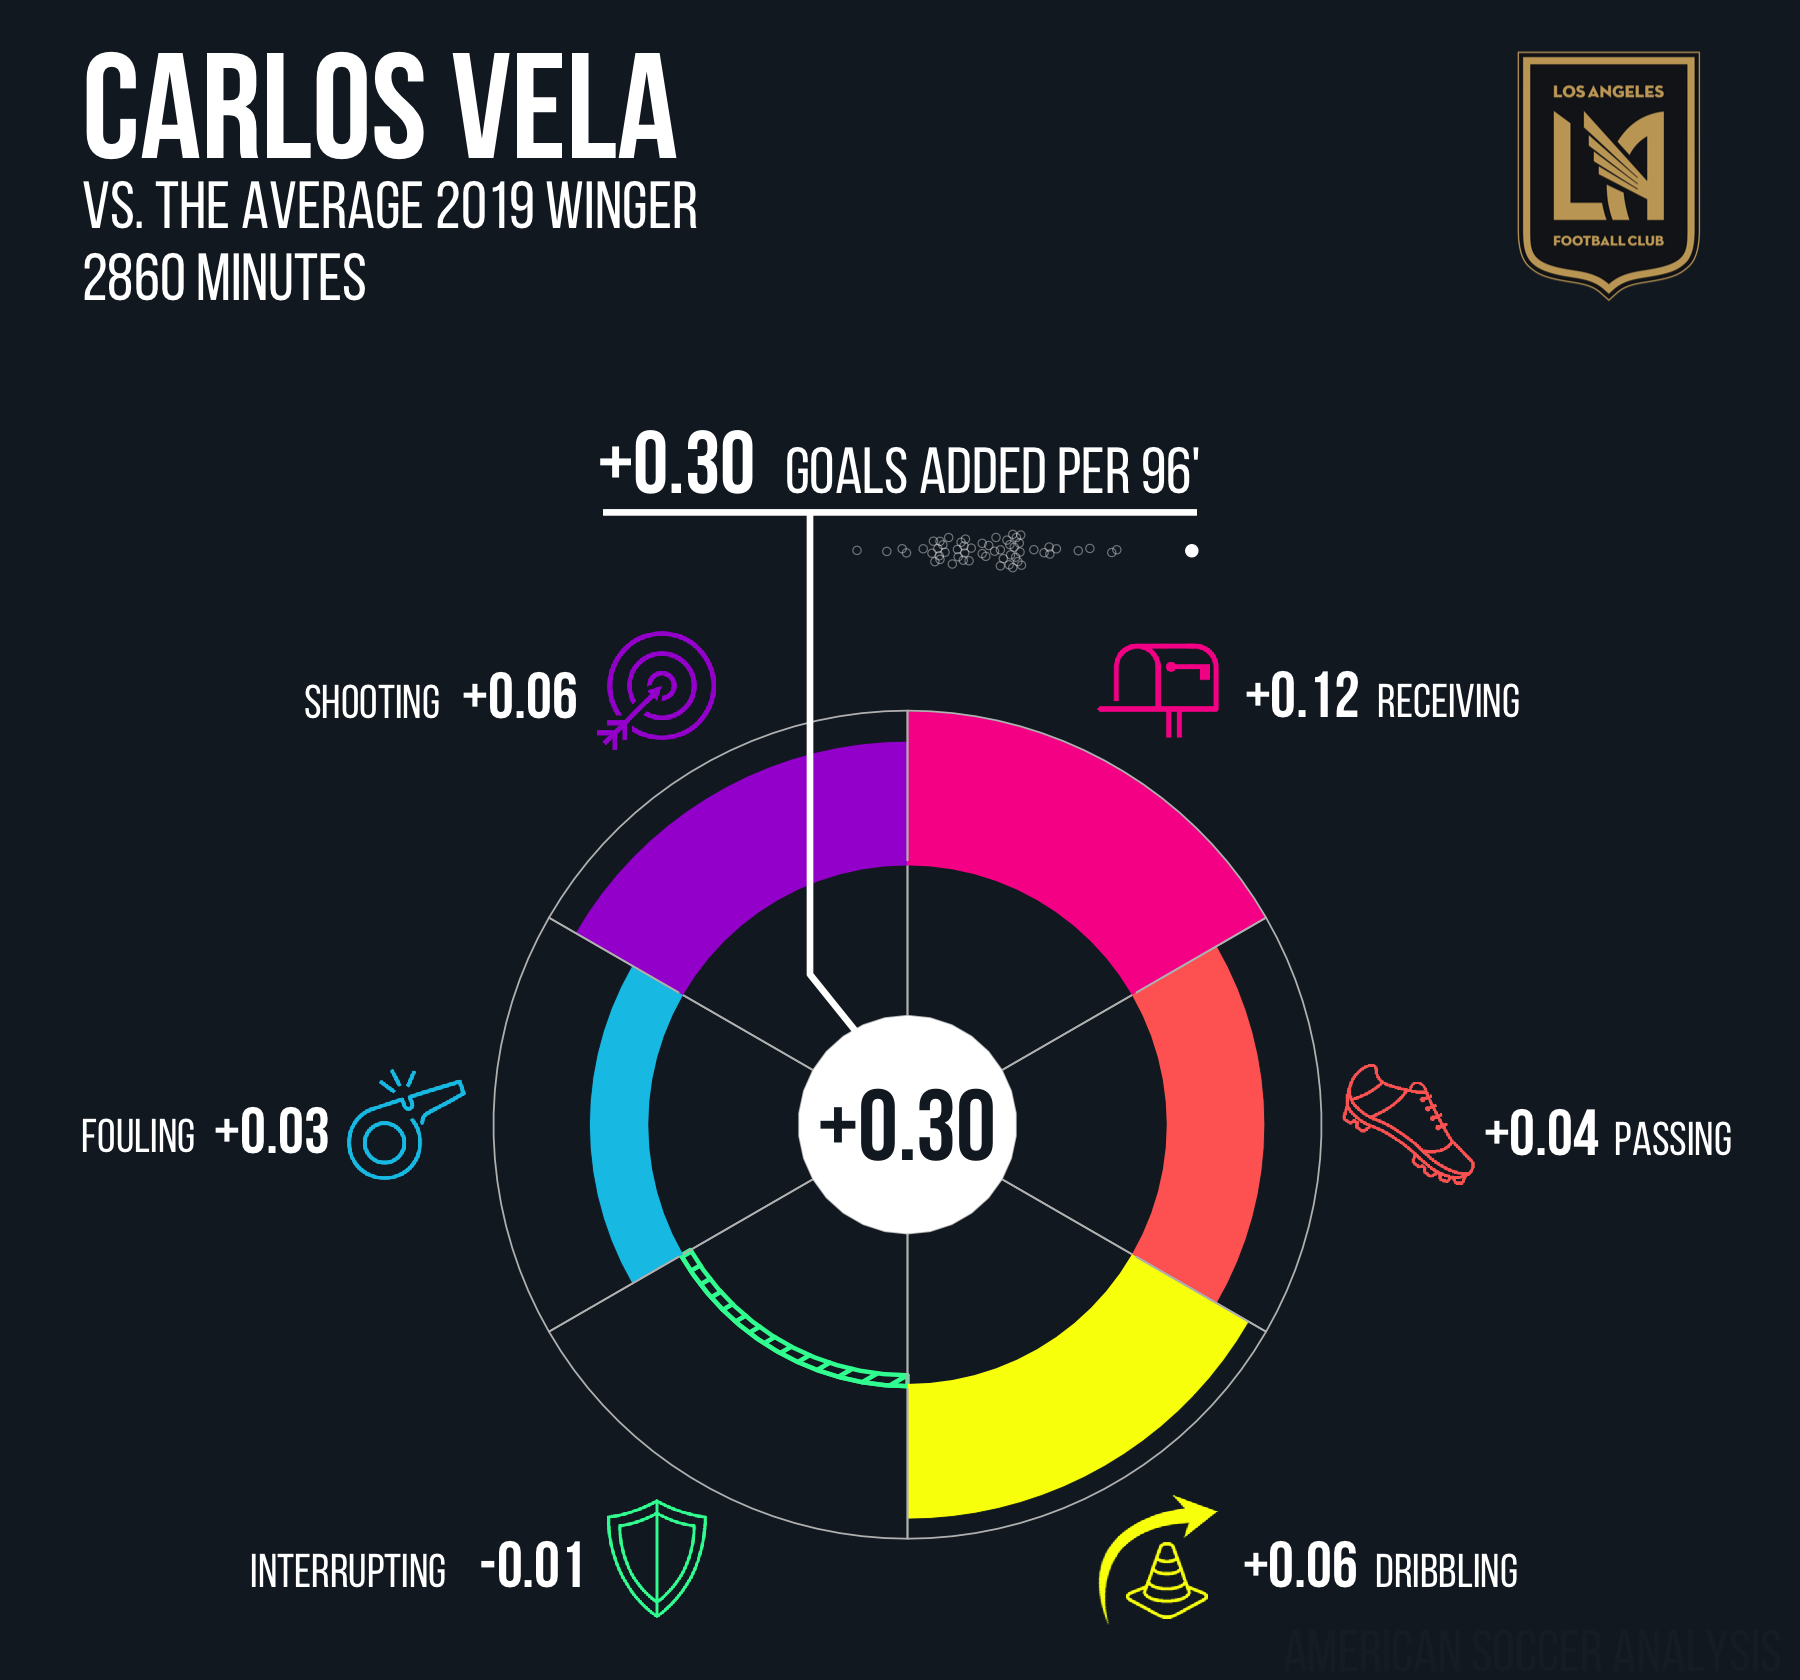
Famously, it is written in the old sacred texts, that all metrics must pass the Messi Test , wherein you basically run the thing, pray, sort high to low, and then stare at the best and worst players and hope that Lionel Messi is at the top. In our case, it was more of a Vela Test. Run the numbers, look the highest and lowest g+ rated MLS players and sigh with relief to see Carlos Vela’s record-breaking season on the top followed by Zlatan Ibrahimovic and Josef Martinez while you have to scroll quite a ways to find Miguel Ibarra, Eric Remedi and Dillon Serna in the rankings. Goals Added passes this test with flying colors.

Further, if we assume that, on the whole, teams pay more in wages to good players (by no means a hard and fast rule!), then we can ask the question: Do MLS teams appear to pay more for higher g+ players? And the answer encouragingly appears to be yes.

Another feather in the cap for g+, even if the y axis in the above chart is a victim of torture.
Probing at the Weak Spots, Identifying Possible Adjustments
The Trouble with Pass Origins
The most common recorded action the model is asked to assign a value to is the pass (and if the pass is successful, to derive a value for the receipt of the pass). I had been doing some side project stuff on passing chains and goal chains, so I took a stab at reconciling observed goal chain values for passes between well-known attacking zones to the outputs of the g+ model and bucketed them into these same zones to try to identify if there were any differences we might care about, and I think I found some. It’s worth rereading the artist Matthias Kullowatz’ detailed methodology explainer, but at a high level, when the g+ model is assessing the probability in a given moment of each team scoring over a two-possession horizon, it “knows” where the ball is, how long the possession has gone on for and if and when any dead ball occurred in the chain. It knows how swiftly the possession has moved vertically or horizontally up to this point. It also knows what the previous action was (e.g. a pass), and if it was a pass, it knows the sorts of traditional xA/xG type attributes that tell us more about the pass (e.g. through ball, cross, body part, long ball) and/or the likelihood of a shot on the end of such a pass becoming a goal.
In the case where the last action was a pass, one thing the model does not “know” is where the pass originated, and my instinct is that this might be a shortcoming because the specific location of recent actions in a possession chain might tell us something about how organized the defense is around the current location of the ball, and thus something about the attacking team’s chance of scoring on the possession. Further, it was certainly intriguing that one powerful predictor of future points per game charted above, “Passes Completed into Areas in front of the Box Ratio” was fully ignorant of any shots. If these areas are so valuable as to predict future GD better than xGD or the g+ model, there’s an opportunity for improvement if we can increase the model’s understanding of these zones relative to other zones and their presence in the possession chain being evaluated.
At some point or another I had organized the last 5 years of MLS passing data into zones that somewhat resemble the pitch markings you sometimes see in the aerial shots of Barcelona or Man City training pitches:
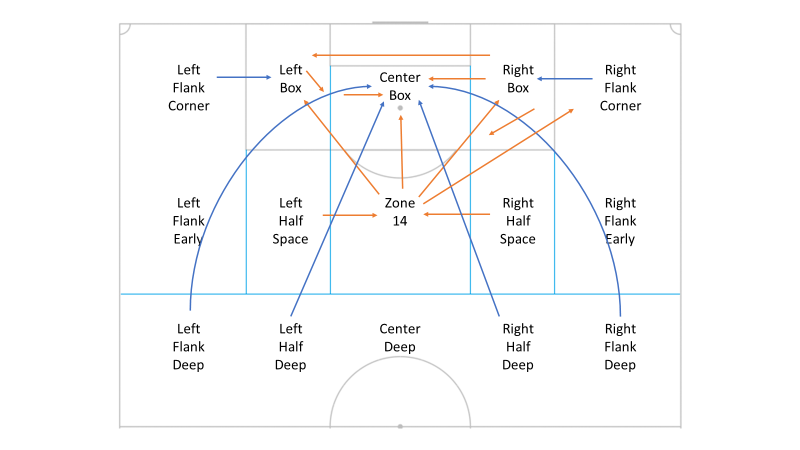
I compared the average observed goal scoring rates on possessions featuring successful passes between these zones to the value the g+ model assigns to the same buckets of successful passes, and found that generally speaking the model agreed with the observed average goal scoring rates when we bucket them all by pass end zones (the columns in the table below). The model disagrees however to an extent with some of the average values of passes from certain zones. In general, g+ appears to assign lower goal scoring probabilities than historically observed to passes that originate in the penalty area or in the central area just outside the box, often labelled “Zone 14” and in exchange as a matter of math, it might overvalue passes from certain deeper locations.
Again, because the model knows the pass destination but doesn’t directly know the origin of the last pass before a probability is calculated, it makes sense then that it would line up closer to observed rates by pass destination zone and less so by pass start zone. I believe this will warrant further discussion and lively debate amongst the ASA staff. In my view, from a soccer perspective, when the ball is in a dangerous zone such as the penalty area or zone 14, defenders are drawn towards it, or at the very least have to react in an organization-disruptive way to deal with the immediate threat, and as such, any successful pass from this zone to another one (or within the same zone) likely carries with it the added advantage of having eliminated additional defenders if successful (beyond the average value of a successful pass to the new zone) because of the gravitational pull on defenses in these dangerous pass origin zones. Specifically, if the ball is played into the right or left sides of the penalty area, on average historically it is more advantageous as a next action to shoot from these areas rather than to pass. Because of this, if the player does not shoot, and instead they successfully complete a pass from one of these areas, we should be thinking a) the defense had to react to the threat in that area to begin with and might now be disorganized, and b) if the player had a 10% shot and chose instead to give this up in favor of a historically low probability pass to the center of the box, and then he completed said pass, there is a good chance his teammate is now wide open with the ball in an extremely high-value area.
While feeding the g+ model a whole new set of predictor variables in the form of x,y coordinate pairs might make certain computers explode before the next version of the model is published or worse, might flood the random enchanted forest with more noise than signal, it’s worth looking into, and we will investigate whether there are elegant, less-taxing ways to teach the model more about where the most recent action in a chain was on the pitch in order to teach it whether game situations are more or less advantageous because of the state of the defensive organization relative to the ball at that moment. Did I mention Matthias is an artist?
I’ll quickly note too, the player lists being generated out of this model feel really good, and so it’s possible that because the model values an action as the change in probabilities between two states, the effects of the above-detailed issue are being nerfed into oblivion or working themselves out through other means, namely the way we allocate value for completed passes between the passer and receiver, which is a decent segue into the next topic.
“The Last Mile” - Controversies with Accounting Elections
One might think about the construction of the g+ Player Value model in three steps: 1) Defining a possession and the unit of account of a two-possession horizon (one for each team), 2) Building the data model to return for each game state the probabilities of the possessing team scoring on the current possession and the defending team scoring on their next possession, and 3) “Doing some accounting” on the outputs of the model in a way that allocates values of the events calculated in Step 2 to the players to suit our needs. If Step 2 has the horsepower of several years of event data and complicated regression and other math concepts I don’t understand that bolster it, Step 3 is a bit judgmental. Sure we now have robust probabilities of each team scoring for every recorded moment in the match, and thus the recorded actions that move one moment to the next, but how do we decide who gets the credit and blame for the actions. Because most on-ball actions are attributed to a single individual, the allocation of their value is not controversial. When it comes to controversy, mostly I’m talking about passes and defense.
The Allocation of Pass and Receipt Value
From what I’ve seen, the mainstream approach to assigning the EPV values of actions to passes is to give the passer 100% of the value for the change in the probability that resulted from his pass (whether that be positive or negative), with the receiving player starting afresh, and gaining credit (or blame) for how his next action changes the probability of scoring from this new game state. Another way to say it is he is fully burdened with the value of the pass he has received.
If you’ve been following the rollout thus far, you probably know that we reject this as the default framework for how the sport works. In soccer, players are tasked with moving and showing for the ball to increase the chance of scoring on the team’s possession or to decrease the chance of their opponent scoring next. At times this means making clever movement to confuse defenders, at other times this means sprinting in behind the lines to create a 1v1 chance, at other times movement is meant to manipulate the defense’s organization to spread them out, to pull a center back away from the backline, or to remove defensive cover from the player on the ball. Sometimes showing for the ball is a necessary act of salvaging rather than improving whatever chances the team is facing, and there’s more of course! Without tracking data, we cannot accurately model all of that, but we can definitely credit players when they show for and receive the ball. We have the technology!
But should we? And how should we do it? We fought about this for a while. The main objection from the “100% to passer Puritans” is that it’s only fair to award the passer the whole value of a completed pass because we don’t have player target data for incomplete passes and so when a pass fails, the passer takes 100% of the blame, even though this is often a team failure to provide passing options to maintain possession, or a miscommunication with the player making the run, or a player misjudging the ball etc.
If we were to agree that some allocation was necessary, then there was also disagreement about which values should be used to allocate. Most of the Convention’s intuition was that the passer deserves the lion’s share of the credit. My own politics favored more of a 50-50 split. One issue with any allocation more “generous” to a receiver, is that players receiving backward passes would be called upon to eat a share of the negative G+ value of the ball moving further from goal (to avoid a more catastrophic complete loss of possession value by the would-be-passer being tackled), and is that fair? They’re just helping out. They don’t want the team to go backward, it just has to. If you don’t eat your g+ someone else will. Quick note: with the benefit of tracking data, we’d likely see the goal probability drop (and the range of outcomes increase) upon the ball-pressure action itself and not upon the choice to pass backward to respond to the pressure, but alas.
Ultimately, John Muller suggested using the dynamic scoring mechanic of xPass with the passer allocated the xPass share of the action value and the receiver allocated 1-xPass, thereby giving a generous helping of g+ to an attacker who sprints onto the end of a through ball, and just a pinprick to a center back who shows for a backward pass to relieve his central midfielder from pressure and recycle possession forward. Meanwhile, the bulk of the negative value for a backward pass is born by the player who was faced with the real-life trade-off of giving up the possession entirely or moving the ball to a slightly less optimal zone temporarily. Lastly, in the name of justice and truth, this method allows us to satiate the “but it’s not fair” crowd and apply a parallel concept to the negative value a player must otherwise bear himself when he fails to complete a pass. We allocate the xPass portion of a failed pass to the passer and allow the remaining 1-xPass to rises up into the ether (henceforth “the angels’ share”). It’s fun! It’s fair! It feels good, man. The resulting value distributions seem to make sense. But it is also a choice… not the output of an AI learning about soccer and then teaching us, and the graph below shows the general impacts of this choice across the positions:
Of the two 100% allocation ends of the spectrum and xPass, xPass appears more reasonable and seems to fix some important things like giving shooters partial credit for creating the shooting opportunity in the first place, something traditional shot-xG does rather well, but all of the knock-on impacts are difficult to trace, and there’s just a general uneasiness with applying a choice like this on the back end of a robust algorithm before the thing spits out rankings of players (rankings which to be fair, on the surface seem pretty excitingly good!). The football logic behind using xPass still feels sturdy enough for a choice like this although some mornings I wake up thinking “wait, if the receiver is showing for a high probability pass, isn’t he “generating a larger pass probability for the passer” compared to when he runs in behind for a lower probability pass – should we be allocating xPass share to the receiver and 1-xpass share to the passer? I think not, but something to ponder. The point is that allocating some share of the pass to the receiving player appears demonstrably correct, but the accounting methodology we landed on is a choice that we will revisit and hopefully figure out clever ways to test and validate and/or adjust in future releases of the Goals Added model. Please give us your feedback.
Adjusting Values with Positional Baselines
As seen clearly above, the current version of the model generates raw scores that are on average higher for the average forward, attacking midfielder and winger, and lower for the average central midfielder. Even if the average value of every position landed perfectly evenly, when creating top ten lists, transfer wish-lists and the like using g+, it would still be important to compare the scores against average or replacement values by position simply because, as again, Thom Lawrence noted in his SB talk that different positions have access to different magnitudes of values per action (“access to different rewards”). The closer to your own goal or to your opponent’s, the greater the consequences of your actions, either to “add goals” for your team or “remove goals” from the opponent, with the players who spend most of their time in the central third, finding themselves in what he referred to as “the valley of Meh.” Remember, because the g+ model (and most EPV models) calculates the value of an action as the difference between the net probability facing the player before his action and after his action, it does by design hold players who have access to greater rewards accountable by burdening them with the value of the advantageous zone within which they are operating. However, a player that plays a perfect game further up the field will ultimately accrue more value than a player who plays a perfect game in the middle of the park, when measured using goal equivalent units (as the model does), but importantly, in this world two perfectly average players might be scored similarly even if playing completely different positions.
Admittedly though, we don’t currently have a model that spits out level g+ scores for the average players at each position. So, another reason to calculate a value “Above Average” or “Above Replacement” is to mitigate the effects of this. Again, similar to making a judgmental choice on how to account for the allocation of event values between players involved, this broad scaling feels slightly awkward compared to a perfect world where we can directly model and account for the positions in a way that leaves us solely with the range of risk/rewards being different between the positions rather than the range and the level of them. While I’m not sure there exists such a natural equilibrium in the sport and with the available data – after all attacking players generally make more money than defenders, especially in MLS – this is one of the reasons why we will continue to iterate not only on the underlying model assumptions but also upon some of the accounting choices we’ve made that have generated outputs to date that suit our needs.
Complex Issue: Allocating Values to Defenders *author faints*
Chances are no one reading this needs to be told that valuing defensive contribution is a nightmare. We know how many tackles, interceptions, clearances, blocked shots, etc. that a player records, and we can value those in the same way we value all actions—by looking at how much the pre-action possession values change between the two game states of before and after the action. When a player interrupts or stops a +0.03 scenario by tackling the ball away to generate a 0.005 net goal difference scenario for his own team, the model awards 0.035 to the defender (the change in the two game states). But what about all the times the player was not in position to intercept the pass or make the tackle or block the shot? And what about the fact that the defender is part of a defensive unit that allowed its opponents to move the ball from a +0.005 scenario into a +0.03 net goal scenario in the first place? It is a problem.
Well, because g+ values the change in goal scoring probability for both teams over two possessions with every recorded action, you could say that at the team level, it can handle offense and defense similarly well. My Goals Added is your … Goals Added conceded. It’s just that the accounting for which individuals get credit and blame for the derived action values is murkier on defense. On offense, every action is attached to at least one player, and so as the attacking team gradually moves the ball forward let’s say and gradually increases the goal probability in their favor, each action attached to these increases is being credited to an attacking player(s) and the attacking players are accruing value, then when an interrupting action occurs, the attacking player who turns the ball over is debited the downwards change in probability values and the defender(s) is credited the same amount (the closer the ball gets to the goal the more the attacker is burdened with the risk of a higher value, and in this sense not only are his actions “possession-adjusted” but they are “possession-value-adjusted”). So, from an accounting perspective, the debits and credits allocated to the players mostly balance out for the team with the ball, but on the defensive front, only the credit side of the ledger (defensive actions) has been allocated to its players. And there are fewer of them. It’s a problem, but it doesn’t mean that we haven’t tracked and recorded the defense’s joint success or failure in changing the goal-scoring probabilities throughout the possession for non-defensive actions. It’s there (it’s Goals Added conceded), but aside from the chance of conceding that the defense inherits upon turnover (already allocated to the player who turned it over), we just haven’t assigned the remaining debit portion of this team number out to the individual defender.
We plan to take a stab at this in version 2, and for sure we will not have been the first. You will often hear defense referred to as the holy grail of soccer analytics, or it will be described as impossible to solve without tracking data. I think if the discussion above about pass/receipt allocation teaches us anything, it is that without judgmental intervention to allocate event values across responsible players, even on the attacking side, expected possession models will largely come up short on the most frequently occurring soccer event, the pass. Rather than a discouraging fact, this should be a call to arms in the noble pursuit of addressing the soccer analytics of defending. Let us not pretend that the event data gives us the perfect information with which to allocate the value of attacking actions, and in the same vein let us not throw our hands up at the task of allocating changes in the probability of conceding that a defense faces as it cedes territory throughout a possession to its opponent. Surely there are some low hanging fruits to chip away at here when we stop trying to definitively assign responsibilities for each action to a single player and start to use footballing sense to come up with reasonable allocation methods. As is always the case in ASA working groups, ideas are flying about and being shot to pieces every day. Stay tuned.
Other Bits
Another hanging chad is whether to include Game State and Home Advantage as input variables into the model or to deal with them on the back end when we use g+ as a tool to answer soccer questions. It is not hard to observe impacts to goal scoring probabilities under different scorelines, team strengths, remaining match times, and venues, - those seem pretty real - but questions remain as to the merits of including them directly into the model or having a model that is ignorant to their effects so that we can answer more abstract questions, untainted by these very real issues.
Conclusion
“Goals Added” is very much a living project at American Soccer Analysis. It is one that we are very proud of, not just because it has been a goal for some time, or because of the degree of difficulty, and not just because the results appear to look like they’re really picking up some signal, but because the process has been an enriching one for all of us who enjoy MLS, analytics, and the sport itself. Most importantly, it gives us something to fight about and investigate now and on an ongoing basis just as much as we already have done so in its preliminary design and implementation phases.
As you can see in this write-up, many compelling questions remain, which gives us an excuse to continue trying to solve a sport that will never be solved. I ran out of words to discuss the myriad of genuinely exciting applications the team is currently developing off of this initial model, but they’re coming.