

Goals Added: How a Computer Watches Nicolas Lodeiro Play Soccer
/by John Muller

Video analysis of a single game can help show us how the goals added model analyzes plays
There’s an old xkcd where a guy standing on top of a giant trash heap of math symbols explains how machine learning works: you dump your data into this junk pile here, see, and answers fall out the other end. And if the answers are wrong? “Just stir the pile until they start looking right,” he shrugs.
Models like goals added (g+) are great at answering wildly complex questions like “How much did this left back’s whiffed tackle at the halfway line change his team’s mathematical probability of scoring next time it gets the ball?” but terrible at telling you how they did it. In that sense the model is sort of like the athletes it’s trained on, guys who get a face full of microphones after every game but, as David Foster Wallace once wrote, “usually turn out to be stunningly inarticulate about just these qualities and experiences that constitute their fascination.” What were you thinking when you derived that bizarre possession value? Well, Sebi, it’s not the result we wanted but we’re just trying to take it one calculation at a time. Thanks to the fans for believing in us.
So how do you know if your fancy machine learning model is working? Same as any other soccer stat, you check to make sure Messi—or Carlos Vela, same difference—is on top. Early g+ player rankings didn't look too bad: thanks to our decision to allocate part of a pass’s value to the receiver, the model was pulling off the surprisingly tricky balancing act required to compare different kinds of players. (When the comparable but receptionless VAEP was published last year, tabloids breezed past the methodology section in their rush to run headlines like “Lionel Messi vs Cristiano Ronaldo: Barcelona star is TWICE as good as Juventus forward, scientists claim.”)
But there was also some weirdness in those first goals added lists. Attacking midfielders in particular looked like their names had been mixed up in one of those tournament ball machines and pulled at random. Our numbers suggested the reigning champion Seattle Sounders’ star playmaker Nicolás Lodeiro, an Uruguayan international still in his prime, was a below-average MLS player at his position. Which, let’s be honest, is flat wrong. But if you’re getting a whiff of something rotten from a model that’s too dark to peek inside, what are you supposed to do about it?
Before you start stirring, you can always go to the tape.
Eyeballs and Algorithms
To try to see what was going on with Lodeiro’s goals added, I recruited some of the sharpest soccer analysts I know for some film study. From American Soccer Analysis, Kieran Doyle and Cheuk Hei Ho signed on (so did Ian L and Tiotal Football, though their ballots didn’t make it into the final tally). Others with statsy backgrounds included Alexander Hopkins and The Outfield’s Kevin Nelson, while the tape-first crowd was well represented by The Athletic’s tactics writer Joseph Lowery along with Sanjiv and Ben Harreld from the gloriously video-obsessed world of USMNT Twitter.
Sounders Director of Soccer Analytics Ravi Ramineni hooked us up with video of an especially fun Seattle game, last August’s 3-3 draw with the New England Revolution. Our project’s ground rules were inspired by Ben’s ingenious player grading system, but instead of rating every involvement, analysts were asked to jot down timestamps for good or bad moments and then whittle them down to Lodeiro’s 10 best and 10 worst plays of the game. No one who wasn’t already involved in the model’s creation was told how it valued plays. Even what constituted a “play,” or what made one “good” or “bad,” was largely left up to the viewer. After all, our goal was to find out whether the algorithm thought like a person.
Did it? Well, sort of. One thing that became obvious early on was that we were dealing in different units of soccer. The model evaluates “actions”—each time a player does a distinct thing on the ball. Analysts’ idea of a “play” was a little broader. One of Kevin’s top plays was a passage where Lodeiro “drops into space to collect from the backline, sprays out to right wing and continues run, gets it back running in behind and shoots just wide.” That’s a lot of actions! To better account for the different frameworks, I compared analyst ratings against the total g+ Lodeiro accumulated in the three seconds before and three seconds after whichever action seemed like the focal point of the analyst’s observation.
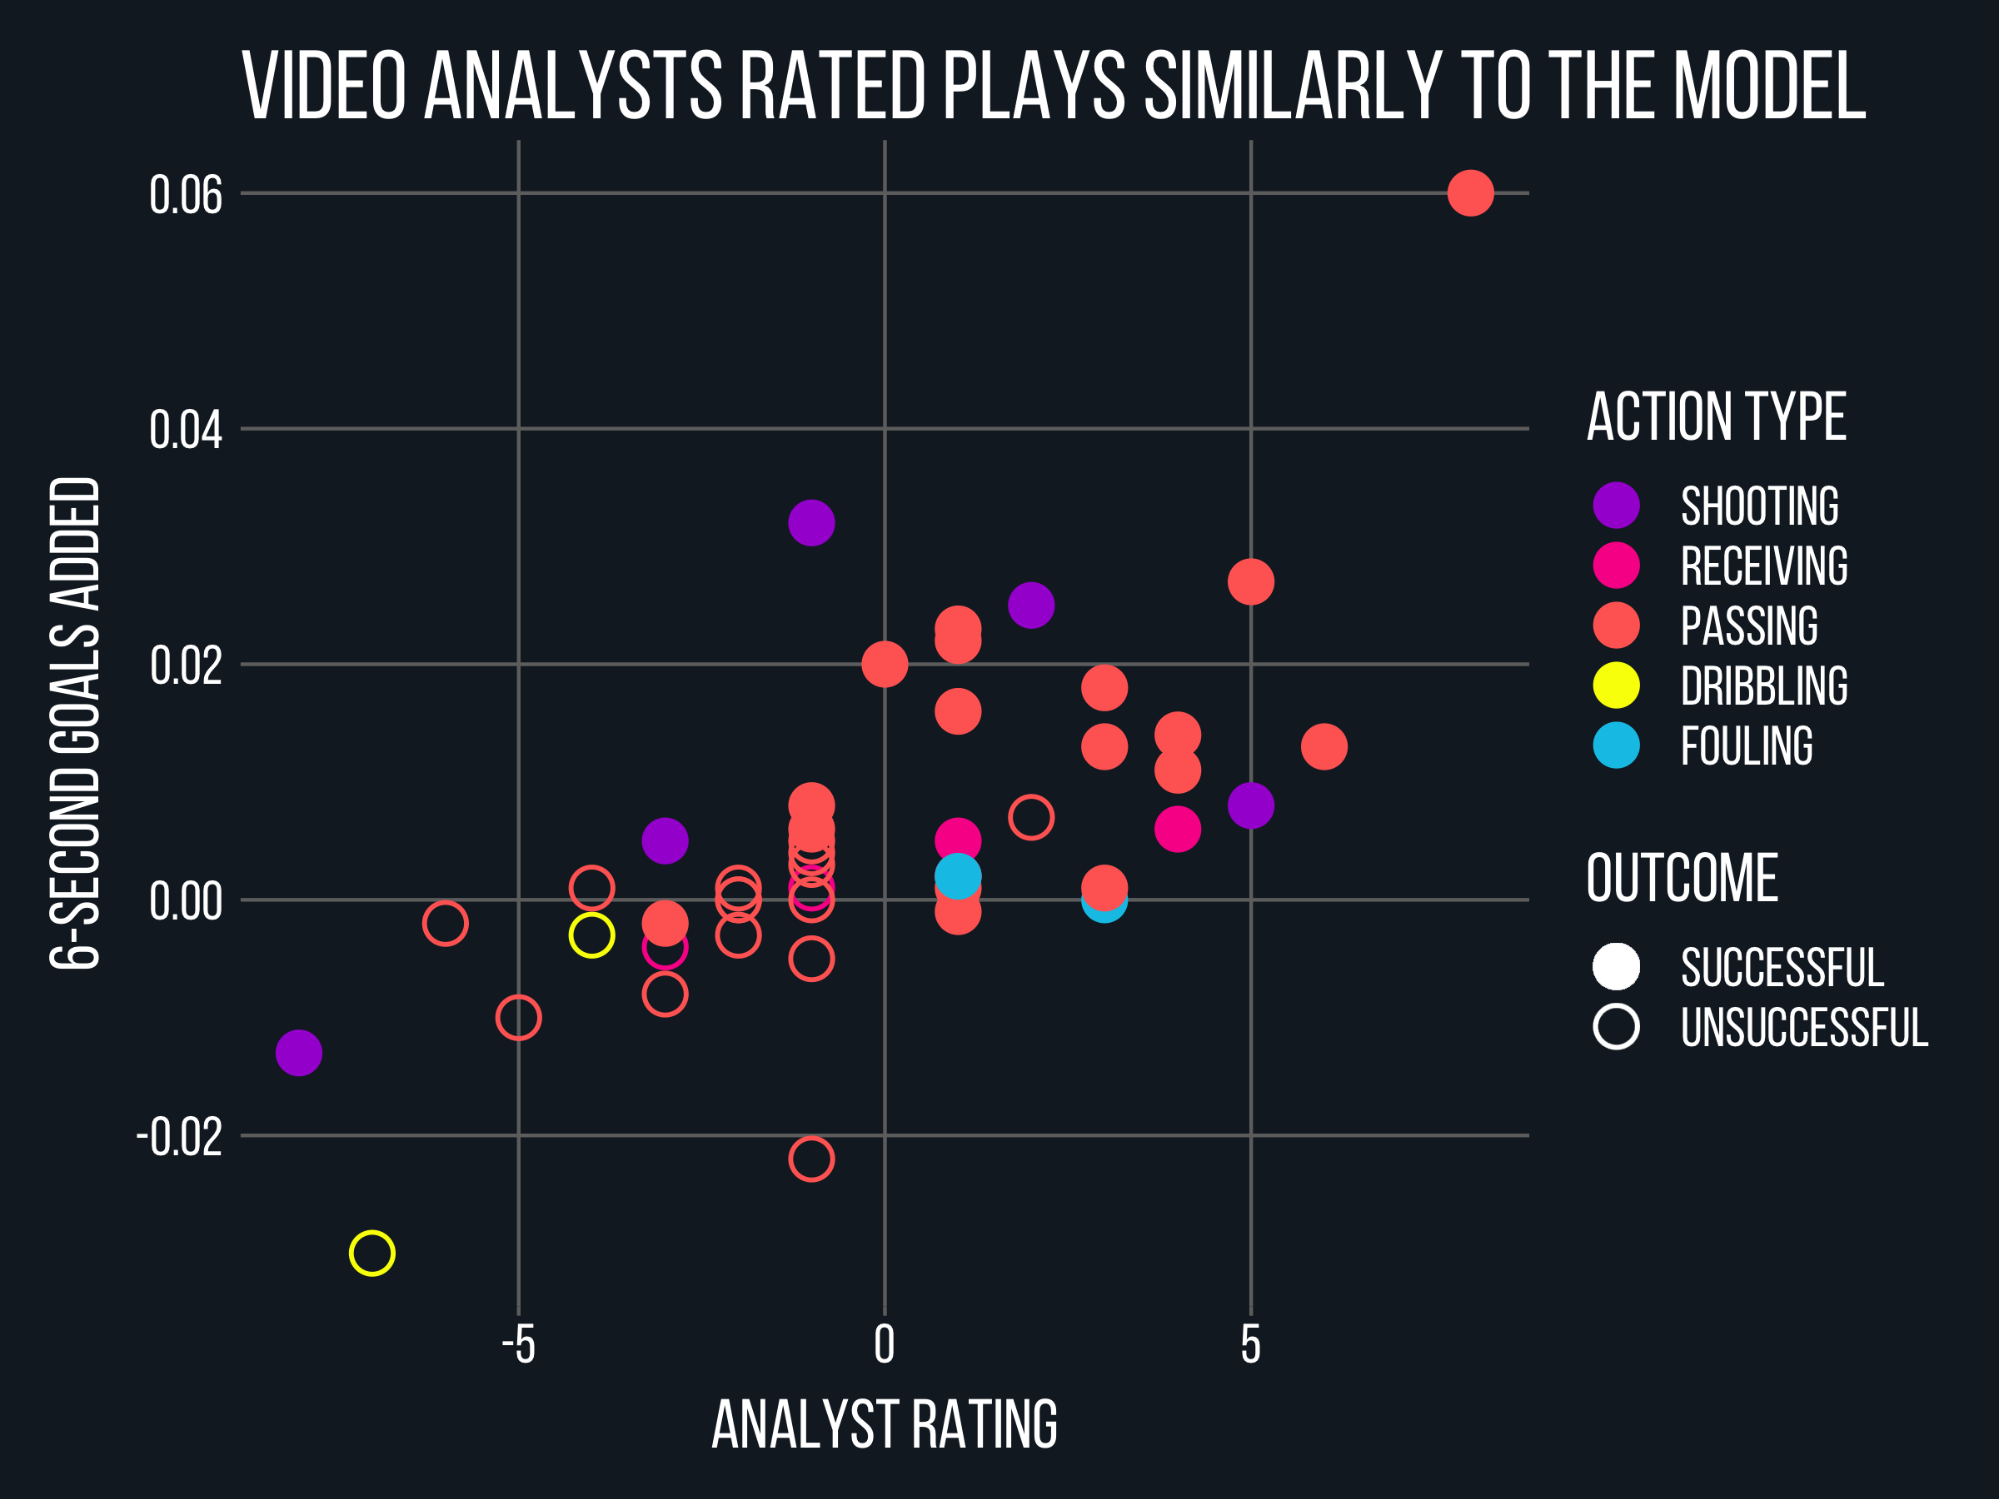
Goals Added for individual plays generally agreed with a simple method of scoring video analysis.
In general, analysts and the model scored Lodeiro’s plays about the same. All eight of our analysts’s good lists had positive goals added (average sum +0.36), and all eight bad lists were negative (average sum -0.05). For individual plays, the correlation between model values and aggregate analyst ratings (scored by adding +1 each time a play appeared on someone’s best plays list, -1 for worst plays) was pretty decent (r2 0.46, p < 0.0001). There were no glaring signs of model bias for or against any particular type of play. In fact, the more analysts agreed with each other about a play, the more likely goals added was to agree with them.
Our video exercise didn’t solve the mystery of why Lodeiro’s numbers were bad. Without spending a lot more man-hours building a larger sample on a more sensitive rating system, we probably couldn’t have hoped to. Luckily that wasn’t necessary. While the analysts were grinding tape, Matthias Kullowatz and crew spotted a conceptual problem in the way the model handled turnovers that was unfairly punishing high-volume attackers. When it was patched, goals added rated Lodeiro as a consistently above-average player at one of MLS’s most talent-rich positions—not Best XI material, but at least high enough to make you wonder whether the gap left between his rating and his reputation had less to do with the model than with how reputations get made.

According to the latest version of goals added, Lodeiro is just outside the top five at his position.
What the video work did give us was a detailed look at how humans evaluate players. And comparing analyst notes to g+ values for specific plays, even if we can’t interpret the data precisely, turns out to be a great way to start getting a feel for the model’s quirks and predilections, its strengths and its blind spots. Ever wanted to know how a computer might watch soccer? Here’s your chance.
Eight Plays That Can Teach Us Something About Goals Added
If you haven’t read Matthias’s explanation of the goals added methodology, now would be a good time. The CliffsNotes version is that g+ values every touch of the ball by measuring how much it improves a team’s situation, measured in terms of scoring chances across two possessions. Those scoring chances are calculated by feeding data about the possession into a machine learning algorithm that compares it to similar possessions to see how likely they were to end in goals. (Trust me, the methodology explains all this way better.)
These eight plays were chosen to illustrate how the model works in practice.
10’ - Failed Throughball
Analysts: 2 good, 3 bad (32nd percentile)
Model: -0.022 goals added (2nd percentile)
The most controversial play of the game. Was Lodeiro a misunderstood genius for even thinking to attempt a one-touch through ball here, or did he throw away a dangerous possession? The analyst vote could've come down to hanging chads and Sandra Day O’Connor. I put this one on my bad plays list, figuring that if Lodeiro had checked his shoulder he might have turned into space and shot instead of trying a risky pass that, even if it came off, would still have left his team one low-percentage cross or cutback away from a look at goal. But Kieran saw more reward than risk in trying to thread it through for the overlapping fullback, since “if unsuccessful it's likely a clearance (regained possession) or a very good opportunity to counter press.” He rated it one of Lodeiro’s best plays. Soccer’s great, isn’t it?
One nice thing about goals added is that it thinks ahead like Kieran, valuing a play not just for how it helps the Sounders’ chance of scoring but also for how it affects what the Revs might do after a turnover. Here, though, the model sided with the analysts who thought the failed through ball was bad. That wasn’t because it could calculate the tightness of Lodeiro’s passing lane between two New England defenders or whether it would have been feasible to turn across his body on a pass that arrived slightly behind him. We don’t have the tracking and body orientation data you’d need to try anything that nuanced. Instead, goals added makes broad guesses about a player’s options based on what’s happened on the ball during the possession so far. Here, for instance, it knew Seattle was five actions into a fast break that had switched play fairly quickly, which might help the model infer that the defense was disorganized. And it had other context too, like that Lodeiro was at the top of the box, that the pass he’d received wasn’t to his head, and that he didn’t move with the ball before passing it. But which of these scraps of information determined his g+?
To answer that question I turned to ASA’s data science whiz Kevin Minkus, who whipped up an interpretability model to tell us what was going on inside the goals added calculation. That’s right, our model has a model. “What this interpretability stuff tries to do is fit a linear model to a very small space in the data—the space that's very close to the observation we care about,” Kevin explained. But the goals added model itself “isn’t linear—its whole strength is its ability to model a complex, non-linear space by using interactions between the variables. So globally, on the whole, stuff like location of the ball is probably most important, but over this small subset we get other random stuff that drives individual predictions.”

The interpretability model suggests that the factors in blue increased these possessions’ value in the goals added calculation, while the factors in orange decreased it.
In this case, the random stuff mostly made sense. Seattle’s possession just before Lodeiro attempts the throughball is valuable because it’s moving upfield fast, it’s close to goal, it’s developed over a number of actions, and it’s in the right halfspace. (That last one is neat because there’s no halfspace flag in the data, which means one of our models simply decided for itself that the second horizontal fifth of the field was a valuable place for a possession to be. Somewhere René Marić is smiling.) After the interception, New England’s possession receives a boost for coming in the run of play but gets dinged for starting in the Revs’ box with low vertical velocity. This all seems intuitive enough.
But now look at that big orange bar at the top of both charts: according to the interpretability model, both possessions are losing a lot of value because they’re within 18 actions (?!) of the last throw-in. Which, uh, what. “Probably good to caveat that these interpretability methods can be noisy,” Kevin said. Shrug emoji.
Weird throw-in fetish aside, goals added liked Seattle’s opportunity for the same reasons our video analysts liked it. The uncomplicated explanation for why Lodeiro loses value here boils down to Cheuk’s notes: “turnover in zone 14 wasted a chance.” All the off-ball nuance we saw in the video is only vaguely suggested by the data, which means Lodeiro’s genius will go unrewarded until, over the course of a season, more of these through balls come off and actually help his team.
What we learned: Like expected goals, goals added deals in general probabilities that work best over large samples.
16’ Through ball to Morris
Analysts: 8 good (99th percentile)
Model: +0.060 goals added (98th percentile)
Did I mention goals added would reward Lodeiro when his through balls came off? Boy, does it ever. This was the only play that made all eight of our analyst’s top 10 lists, and it was the model’s second-favorite of the game. But the cool part is that, even though this pass is obviously very good, without goals added we wouldn’t have a way to capture its very goodness. Jordan Morris doesn’t get a shot off, so Lodeiro wouldn’t record a key pass or any shot-based expected assist value for passing to him. Because Morris’s cutback is intercepted, Lodeiro won’t be credited with a second assist, shot-creating action, or expected goal chain value for involvement further back in a shot chain. By the time Morris even gets a touch on the ball he’s already at too wide an angle for a good shot, so even non-shot expected goal models like xPG might not give the through ball the credit it deserves. At best our standard stat toolbox might credit Lodeiro with a progressive pass, but those are relatively common (and no one can agree on how to define them anyway).
Unlike location- and shot-based stats, goals added measures possession value in a holistic, forward-looking way. The model doesn’t care if Lodeiro’s pass actually led to a goal or even a good shooting position. Instead, it asks whether a pass puts the recipient in a situation that’s likely to lead to a goal—which is exactly what our analysts loved about the play. “Plays the ball between the lines to put Morris in behind,” Sanjiv wrote. “Opportunity for a cutback but nothing comes of it.” He rated it one of Lodeiro’s best moments of the game.
What we learned: Goals added captures situations, not just locations or shot chains.
23’ - Reception from Shipp
Analysts: 4 good (86th percentile)
Model: +0.006 goals added (68th percentile)
It’s the sad truth that event-data metrics are generally blind to off-ball contributions. When Lodeiro “spotted a pocket of space behind the backline and moved to exploit it,” as Joe wrote in his notes here, most models would struggle to credit him for it. They’d grade Lodeiro on his attempted cross after the run, sure, but that’s not what makes the play valuable. The important thing, Ben explained, is how his movement “keeps the ball for his team and gets into space.”
Thanks to the model’s innovative reception values, goals added does a pretty good job with this play. Actually, crediting “the model” for that idea isn’t quite accurate—it was Tiotal Football who persuaded ASA that we needed to impose an allocation method on goals added to split pass values between passer and receiver. Why? For the exact reason you see in this play. “The attacking player,” Tiotal argued, “is himself the creator of the opportunity.” Shipp wouldn’t even have the option to release this play up the wing if Lodeiro, who’s in his own half fighting for the ball just a moment earlier, doesn’t spot room behind New England’s fullback and decide to make an alert curling run into it.
But how much of the credit should go to the receiver and how much to the passer? After kicking around a few possibilities, we settled on the (admittedly sort of arbitrary) method of giving the passer a share equal to the expected completion percentage of his pass, on the theory that the hardest passes to complete are typically the ones where the receiver has to put in the most work. That thinking works out pretty well here, where our expected pass model gave Shipp’s pass—a vertical longball from his own half, up against the sideline—just a 54% chance of success. The allocation method correctly assumes the receiver has done good work to get on the other end and awards Lodeiro 1 - xPass = 46% of the pass’s +0.012 goals added, for a receiving share worth +0.006.
What we learned: Receiving values allow goals added to recognize some off-ball work.
35’ - Defensive Lapse
Analysts: 2 bad (21st percentile)
Model: N/A
Unfortunately, a lot of things that happen off the ball still elude us. There’s nothing in the data that’s going to reflect how Lodeiro “turned off in response to Morris turnover and allowed a pass to go right past him that he should have been able to prevent,” as one analyst wrote. “Revs ultimately score.”
It’s no secret that measuring defense is a problem for soccer analytics. Goals added does award players interrupting value for breaking up possessions through stuff like tackles and interceptions, but on-ball events make up a tiny fraction of what players contribute, or in this case don’t, to their team’s defensive effort. Though we hope to make some progress on defense in future versions of the model, until tracking data is widespread your default attitude toward defensive stats should be narrow-eyed skepticism.
In the model’s defense, it does at least steer clear of backward-looking analysis. Would anyone have counted Lodeiro’s momentary failure to block a passing lane one of his ten worst plays if the Revs hadn’t gone on to score eight passes and sixty yards later? A ball that winds up in the back of the net can do funny things to human psychology, and it may have had an outsize impact on our analysts’ ratings here.
What we learned: Goals added can’t evaluate most defensive efforts (but it’s probably a good thing that it doesn’t care about goals).
50’ - Switch to Ruidíaz
Analysts: 3 good (79th percentile)
Model: +0.013 goals added (79th percentile)
Since this play landed in the exact same percentile of both our analyst and model ratings, we’re going to take it as proof that the model is flawless and call it a day. No questions, thank you.
No, what’s neat about this switch is that it’s a pass in the middle of a possession, not a ball around the box or even into the final third, and yet g+ values it for the way it opens up Seattle’s possession following a series of short passes that were likely to draw defenders to the sideline. Even after granting Raúl Ruidíaz 32% of the credit for the reception (a smaller share than Lodeiro got for his more difficult run at 23’—score another one for the xPass allocation method), the model gives Lodeiro a generous goals added credit for a switch that, as Ben wrote, “puts teammate in a lot of dangerous space.”
Once again, beyond credit for a completed pass, there’s not a widely used stat that’s likely to call attention to the way this switch improves Seattle’s position. Analytics has been so focused on shot-based metrics for most of the last decade that our toolbox for evaluating passes is a lot emptier than it probably should be. And though non-shot xG can be useful at either end of the pitch, it won’t tell you much about a pass that starts and ends in the middle third, well outside shooting distance from either goal. You need a possession value framework here.
What we learned: Passes in the middle third are especially hard to evaluate, but goals added can help by measuring context.
53’ - Dispossessed by Bunbury
Analysts: 7 bad (2nd percentile)
Model: -0.030 goals added (1st percentile)
Here’s a case study in the difference between plays and actions, as Lodeiro notches three distinct actions in the course of one very brief, very bad play. First, for receiving a short sideways pass at midfield, he earns a grand total of +0.000 goals added. Next we have a, uh … what exactly is that? It looks like Lodeiro tries and fails to stop a pass when he realizes his teammate isn’t going to pull up his run to receive it, but the event is recorded, fairly enough, as a bad touch. In a rush to make up for his mistake, Lodeiro slides in on Teal Bunbury but the challenge misses both ball and man and Bunbury scampers off toward goal.
All told, the model punishes Lodeiro with a game-low -0.030 goals added for this sequence, which lines up with how much our analysts hated it. But the interesting thing is that the turnover itself only costs Lodeiro -0.012 goals added; the model thinks the greater sin is the missed tackle afterward, at -0.018 goals added.
It’s not clear from our analysts’ notes that they’d sign off on that division of blame. Seven of eight put this play on their bad list, but most comments focused on the weird lost ball (“seemed to overthink and second guess himself,” “mishit a pass or something”) and Seattle's abrupt transition from launching a counter to defending one. Only Kevin Nelson mentioned Lodeiro’s challenge, which compounds the damage by eliminating the first defender to give New England a free run at goal. I asked Kevin which was worse, the turnover or the tackle. “I would give the poor pass 80-85% of the negative value on first blush,” he said. “Even the best case scenario, winning that tackle, still means Seattle wasted the counter opportunity.”
So goals added is heavily outvoted here. But there’s an underlying logic to its treatment of this play that’s worth taking a closer look at, because it also happens to be the logic that bumped Lodeiro up from below average to above average for his position, where we expected him to be. This is about turnovers. You’ll remember that goals added is always looking at two possessions, the chance of scoring while you have the ball and the chance of conceding if the other team gets it. But which two possessions do you use when one team has the ball before an action and the other team has it afterward?
It might help to put some numbers on this. When Lodeiro first receives the ball, Seattle has a 1.7% (or 0.017) chance of scoring on the current possession and a 1.3% chance of conceding on New England’s next possession. After Bunbury scoops up Lodeiro’s heavy touch, New England has a 2.0% chance of scoring on their possession and a 0.8% chance of conceding on Seattle’s next possession. If we insisted on using the same two possessions in calculating the before and after parts of Lodeiro’s goals added for the turnover, we’d have to charge him with -0.017 goals for reducing Seattle’s chance of scoring on its original possession to zero and -0.020 for New England’s new chance of scoring. Seattle’s as-yet-hypothetical next possession wouldn’t enter into the equation. On that math Lodeiro’s turnover would cost him -0.037 goals added—a very high number that, to be fair, would probably be closer to our video analysts’ sense of how bad it was.
If you count turnovers that way, though, you wind up crushing guys who touch the ball a lot. Even on a player’s best actions the opponent’s chance of scoring would never go to zero, but on his worst actions, losses of possession, his team’s chance of scoring would always go to zero. Being the guy who tries to make stuff happen for your team would be a losing proposition, goals added–wise. But more than just screwing up the model’s player rankings, that arithmetic doesn’t line up with the implicit risk-reward calculus that guides players’ choices on the field. If an attacking mid decides to try to slip a ball into the box, for example, he knows that if the pass doesn’t come off his team will be in a good position to counterpress or recover a clearance in the opposing half and attack again. Their chance of scoring across two possessions never goes to zero. Soccer is a fluid game. That’s what makes trying stuff worthwhile.
Goals added is pro-trying stuff. To make sure nobody’s chance of scoring is ever fully zeroed out, our turnover math looks across three possessions at the instant of the turnover. Here that means Lodeiro gets charged with (0.020 New England chance of scoring after the turnover - 0.008 Seattle chance of scoring on its next possession) - (0.017 Seattle chance of scoring on its previous possession before the turnover - 0.013 New England chance of scoring before the turnover) = -0.012 goals added.
Look, I’m sorry, but it was important that you understood where that number came from. That was as painful for me as it was for you.
So anyway, the model figures that losing the ball is bad, yes, but not all that bad because you can win it back and attack again. But if the player in the best position to counterpress—in this case, the guy who lost the ball, one Marcelo Nicolás Lodeiro Benítez—immediately takes himself out of the play by going to ground, now you’re really hurting. To beat a man is to break a line. Bunbury gains time and space from Lodeiro’s missed tackle, which boosts New England’s chance of scoring from 2.0% to 4.0%, and that increased danger is why the challenge costs Lodeiro so much g+. We forced our machine learning model to scroll through 10,000 hours of soccer Twitter and it came back quoting Paolo Maldini: “If I have to make a tackle, I have already made a mistake.”
What we learned: Goals added’s three-possession horizon on turnovers may not always line up with our intuition. Overall, though, it smooths things out so that the model doesn’t punish players for involvement.
66’ - Goal
Analysts: 5 good (91st percentile)
Model: +0.008 goals added (74th percentile)
Analytics hasn’t yet changed soccer as dramatically as the death of the midrange jumper changed basketball, but as expected goals has caught on we’ve seen teams start shooting closer to goal. This is progress! Shooting from outside the box is, in general, an inefficient way to use a possession, and figuring out how to get the most out of possessions is one way analytics can help you win.
The great tragedy is that shooting from distance also happens to be a lot of fun, and scoring goals is fun, and the Lilliputian percentages involved in scoring from distance are the exact reason why we award these goals our species’ highest honor, heavily filtered YouTube videos with EDM soundtracks. No wonder everyone thinks xG is joyless.
You could see that cognitive dissonance in the comments on Lodeiro’s long-range strike, even as our analysts added it to their list of top plays: “Got fortunate.” “Fortunate to score but good positioning.” “I'm putting this on here because I feel like I have to.” Three of eight didn’t think scoring the go-ahead goal was one of Lodeiro’s 10 best plays of the game.
Possession value models face a similar dilemma with shots like this. One way you could choose to value shots is to reward players for increasing their team’s chance of scoring on that possession to 100% when the ball goes in and punish them for reducing it to 0% when it doesn’t. This more or less jibes with how the model values other actions, but it would have the unfortunate effect of valuing shooters for their goals minus expected goals, a notoriously noisy finishing stat. On a season level, it would mostly tell you which shooters got lucky that year. For individual plays, it would tell you that any shot that happens to go in was an absolutely brilliant decision and every shot that the keeper gets a glove to is a catastrophic failure on par with giving the ball away in your own box.
What goals added does instead is assign shots their xG value plus a little extra expected rebound bonus if the shot is on target. Since we deduct as opportunity cost the value of the possession before the shot, which is basically the same thing as the expected goal calculation, shots in themselves aren’t worth much. As far as the model is concerned, the main way attackers create value is by getting in good shooting positions in the first place. So Lodeiro gets a modest goals added bump for putting the ball on frame, but much like our analysts, the model privately wonders if maybe he should have worked the ball into a better spot instead of going for glory.
What we learned: Goals added rewards players for getting in good shooting positions, not for scoring lucky goals.
69’ - Shot from Own Half
Analysts: 3 bad (11th percentile)
Model: +0.005 goals added (63rd percentile)
Oh boy. Yikes. Look, there are very few situations in which soccer people are likely to tell you that it’s a good idea to shoot from your own half. To be honest, it feels like Lodeiro got off a little light by only making three analysts’ worst plays lists with this baffling decision to try to chip Matt Turner from 80 yards.
And yet goals added thinks the shot … improved Seattle’s situation? Yeah, this one’s a head-scratcher. It mostly has to do with that three-possession turnover horizon we talked about earlier. For starters, goals added thinks the possession that Lodeiro threw away was worthless: Seattle’s on the ball in their own half, shortly after a turnover, with very little vertical velocity, so either team has about the same chance of scoring in the near future. After the shot—that is, after Turner catches it in his own box—New England’s possession actually has a negative value, since the chance of scoring on a possession starting from the keeper is less than Seattle’s chance of scoring from the next turnover. Putting your opponent in a negative situation is better than being in a neutral situation yourself. This is basic field position math.
The model’s reasoning here will be familiar to anybody who’s ever watched an NFL coach bring on the punting unit at 4th and 2 from the 50-yard line. Sure, you could try to keep the ball, but going for it would give both teams a similar chance of winding up with a first down around the 50, which would mean both teams have a similar chance to score next. (Or at least that’s how coaches think. According to analytics types, this example might work better on 4th and 8.) On the other hand, if you can pin the other team against the goal line with a coffin corner punt, they’re less likely to score than to give the ball back to you in a good position. If you look across three possessions, punting the ball away is a net positive.
Has goals added discovered a vast inefficiency in the way soccer is played? Should more teams be booting away midfield possession so they can press high? Hey, it worked for the 2018 New York Red Bulls. The truth is, aberrant plays produce aberrant stats, and you probably (definitely) shouldn’t add this shot to your Football Manager playbook. But even freak goals added values can raise questions worth thinking about.
What we learned: Models are weird. Or Jesse Marsch is a genius. Probably both.
Conclusion
Because they’re hard to interpret, machine learning models require careful validation from data science types and trust from the rest of us. But that doesn't mean our trust has to be blind. It helps to make sure that what goals added is telling us makes sense with what we see on the field. Even though a model that deals in event data and probabilities isn’t designed to get every play exactly right, it needs to get most plays mostly right if we’re going to use it for game-level analysis.
It’s reassuring to see that goals added generally agrees with our video analysts. It’s also illuminating to think about the plays where it doesn’t. All models are wrong, the saying goes, but some are useful. In the end, the best use for soccer models might be the way they make us think harder about the game. And thinking harder about the game will help us make better models—maybe even one that will appreciate Nicolás Lodeiro.