

MVP, Positions, and the Problem with Usage in Soccer
/By Kieran Doyle
Way back in May, American Soccer Analysis broke out our fancy new model, Goals Added, as a way to help us evaluate what is actually going on during the innards of a possession that drives chance creation. As John Muller so aptly put it, “Thanks to expected goals, we’ve gotten good at valuing shots, but shots won’t tell you much about the ninety-plus-minute scramble that produces just 26 total chances over the course of your average MLS game and maybe three goals if you’re lucky. Shots make up about three seconds of action for every four minutes of soccer. Grading the sport on that alone is like assigning GPA based on how well students walk across the graduation stage.” Goals Added gave us the chance to see how much the water carriers and the ball winners and the zone movers actually impact things, beyond just looking at your fancy DP strikers.
Fast forward seven months and another MLS season is in the books, Columbus are your champs, the Union won the shield, Cincinnati remained glued to the bottom of the standings. Diego Rossi won the Golden Boot, Robert Beric won the xGolden Boot, Matt Turner was snubbed of Goalkeeper of the Year, and some things never change. There was even a g+ best X (we’ll come back to you eventually goalkeepers, I promise).

If you look closely, you’ll notice a conspicuous absence: MLS Most Valuable Player, Alejandro Pozuelo.
Alejandro Pozuelo, Most Valuable Player?
… what?
Pozuelo put up nine goals on 8.45 xG (caveated by almost half of that being from set pieces), good for 9th in the league and 1st amongst non-forwards (even if we have him listed as a striker, we’ll come back to this later). His 68 key passes (league best) led to seven assists (league best) and 8.48 xA (league best). If we mix in some data from StatsBomb and Football Reference, his 117 passes into the final third was 7th best and 82 passes into the penalty area was league best by a mile, and he played the second most progressive passes with 165. Similarly, Pozuelo dropped 109 shot creating actions (one of the two actions immediately preceding a shot), good for the second in the league. This is a pretty clear MVP resume! Goal scoring, chance creation, ball progression, the all around attacking star. So... he just missed out on g+ best X, right?
Nope.

That image above says that he was essentially a league-average player. Well, that’s unexpected. If we’re keeping the idea of looking at ranks, Pozuelo’s g+ above average of +0.08 for the season (+0.00 per 96) clocks in at 223rd, wedged between Eric Calvillo and Zico Bailey. What’s going on? Why is he a striker? Why does he look so average? To create useful baselines for g+ above the average player at their position, we had to assign positions to players (and players to positions). Strikers have access to different opportunities than fullbacks or defensive midfielders, and receptions in the box are just way more valuable than a switch of play, no matter how you slice it. Similarly, we don’t really know who was targeted if a pass was unsuccessful, so we can’t punish someone for not getting open or something like that. This means that in raw g+ terms, strikers can consistently accrue more value than other players. Creating positional averages as the tool across which we compare players helps to alleviate some of these positional inequities. To do so, we basically put all the formations that have been played, and made broad but useful position groups. Midfielder is too broad, but LF, LW, LM are too narrow. We end up with nice blocks of FB, CB, DM, CM, AM, W, ST. To assign players into the appropriate role, we look at what formation they allegedly played, then convert their role in that shape to one of those groups. A flat 4-4-2 has two strikers, two wingers, and two center midfielders but a 4-2-3-1 has two defensive midfielders, an attacking midfielder, and one striker.
For the most part, this system works really well! It stratifies things nicely. The g+ above average list is all pretty good players, the positions all look right… except for Pozuelo. Toronto FC played what I would call 4-2-3-1 for the majority of the year with two recognized midfielders of some denomination, a proper striker, and Pozuelo nominally was the 10 but free to float as he pleased. However, this was almost always listed as a 4-4-1-1 in the data, with Pozuelo as a “second striker.” This is problematic because in most cases, the second striker of a 4-4-1-1 is just Ben Olsen telling his littler striker to run around more. Because of the aforementioned position problems, that player gets bundled with other “receive the box and shoot” types, rather than creative #10 types. So Pozuelo gets called a striker on the g+ above average and is compared against other strikers’ rather than other 10s, vastly reducing his g+ value above average.

Let’s pretend that never happened, what do his raw numbers - which ignore his position - look like? Well, on raw g+ production Pozuelo shoots up to 15th, at 5.34 goals added. He moves up 207 spots in the rankings, but it’s still a far cry from what his xG, xA and passing production might suggest. What if we fix his position? We can force the model into thinking he played 100% of his minutes in a bunch of positions (instead of the mostly striker, some winger, few midfielder minutes he’s played now) and see where he ranks best. Does he look good again? Better, but also no.
Fixing his position helps, but still doesn’t suggest an MVP level season in the g+, even when we try to force him as far back as a central midfielder. It’s clear that the ball progression and passing into the penalty area and final third stuff he does is much more valuable than the somewhat striker-y stuff he does. When you call him a striker and compare him to other strikers, but he doesn’t do enough of the high value receiving work that a traditional striker does that g+ loves so much, of course he looks bad. However, this still doesn’t explain why he doesn’t shoot to the top of the list when listed as a hypothetical attacking midfielder. When we zoom into his league-leading passing and creative numbers, g+ is still not impressed. What’s going on here? If all the counting stats like him but the value based stats do not, where do we go from here? The answer to that question lies with Russell Westbrook.
Russell Westbrook and the Problem with Usage in Soccer
In 2016-17, Russell Westbrook put up 31.6 points, 10.4 assists and 10.7 rebounds, averaging a very impressive triple double on his way to the NBA Most Valuable Player Award. Some people would argue there were a lot of empty calories in there, but for NBA statheads he also ran a league best PER (player efficiency rating) and VORP (Value over Replacement Player). He also, by quite a margin, led the league in usage at 41.7.
In basketball, people think about usage in terms of possession ending actions. As basically every possession ends in a shot, usage rate gives you a fairly good glimpse of how much of a team's production runs through a given player. Like everything, there’s some nuance required there (mainstream NBA stats has at least four different and meaningful versions of usage), but it is roughly defined as the number of shots a player takes (field goals and free throws) plus the player’s turnovers, as a fraction of the whole teams’ shots and turnovers. In Westbrook’s case, that 41.7 means out of 100 possessions OKC might have, roughly 42 of them will end with Russ shooting, going to the line, or turning the ball over. The caveat for all of that usage is Westbrook had a much less impressive 55% true shooting, or 89th in the league, far lower than his MVP competitors. Russ saw a lot of the ball, put up big numbers, but not very efficiently.

Fig. Usage-Efficiency Boundary from Nylon Calculus. X-axis is usage, Y-axis is efficiency. Westbrook is the red dot in the bottom right.
If we think about how production scales with usage, it is really hard to shoot efficiently with more and more usage. If the opposition knows that the possession is going to end with Westbrook, they’re probably going to defend that more and make him take more difficult shots or attempt more difficult passes. This is born out through something of a “usage-efficiency boundary” (outlined rather interestingly in one of the old Nylon Calculus posts based on the concept from Evan Zamir). If you plot out true shooting percentage against usage, you can draw an imaginary line from 40% usage to 65% true shooting, leaving you only the truly exceptional seasons on the right-hand side of said line. This relationship is compounded further by comparing his true shooting percentage to other MVP candidates with lower usage rates (Kawhi, Harden, Lebron, Isaiah Thomas and Steph all finished with over 61 TS%). Russ put up huge numbers on gargantuan usage, while those guys put up huge numbers on merely huge usage.
So how does all this apply to Pozuelo? Maybe Pozuelo has been burdened with so much of Toronto’s attack that his passes are harder, his shots more pressured, or his dribbles more surrounded because teams know he has to do his thing. He’s able to rack up xG and xA and progressive passes because he’s so central to everything Toronto does, less because he’s some innate superstar. The volume is real, but g+ hates his efficiency. If we look at possession ending actions, following a similar methodology to basketball as a percentage of team possession ending actions, we can get a handle on a preliminary thought of usage. This has been looked at a little bit before by LAFC’s own Max Odenheimer, back when he wrote for StatsBomb, showing the difficulty of fitting in high usage ball-dominant attackers like Memphis Depay.

Action usage % here is the percentage of possession ending actions a player takes of the team's total possession ending actions when they are on the field. Possession ending actions here are incomplete passes, shots, failed take ons, dispossessions and “ball touches” (failed receptions).
There is a fairly lengthy list of folks ahead of Pozuelo from an action perspective, some of whom are liked by g+ (Pavon, Quintero, Morgan), some of whom are not (Zelarayan). There are two pretty clear profiles here, 1) ball dominant attackers who are the creative hub of their team (Lodeiro, Quintero, Nani) and 2) wingers/fullbacks who cross a lot (Gressel, Lovitz, Adnan). Pozuelo definitely falls into the former category, but he appears lower than I expected. If we look into the total number of possession ending actions, Pozuelo shoots up to fifth.
But soccer is decidedly not basketball, and possessions are much less likely to end in a scoring opportunity. Shots are less “used” than they are created and holding high risk high reward “home run” type passes to the same measuring stick as regular possession play feels like it’s missing a trick. Another direction we can go is to consider the “burden” a player is entrusted with. When we evaluate action values in g+, we look at the change in probability of a team scoring on this possession (and the opposition scoring on the next possession) before and after the action. A term we use in the ASA-verse is that a player is “burdened” with the “prevalue” of that possession, the probability of the possession ending in a goal before they do anything with it.
Here’s an example: during the Toronto-Montreal goalfest at MLS is back, Pozuelo receives from Piatti before laying the ball on a plate for Ayo Akinola. When Pozuelo receives, we know based on the circumstances of the possession and where he gets the ball that this possession ends in a goal 5% of the time. As such, he’s starting with a “burden” of 0.05 g+. He then completes a great pass to Akinola, creating 0.56 g+ of value split 0.14/0.42 between himself and Akinola. If we look at the sum of all of those possession values the player receives before they go and do something with it, we can calculate their g+ “burden” and get a sense of how much value they use, rather than how many possessions they use.

Fig. g+ burden here is the sum of possession values at the start of any action by the player, while the value usage% is the players g+ burden divided by the sum of possession values before all team actions.
There’s the jackpot: Pozuelo uses the most value in the league by a mile. In terms of g+ burden, the gap between Pozuelo and Lodeiro (the action-based usage leader) is the same as the gap between Lodeiro in 2nd, and Jordan Morris in 10th, and the same as the gap between Morris and Lucas Cavallini, who is 91st. Pozuelo is burdened with over 30% more value over the course of the season than his nearest counterpart. This meshes well with my feelings on how Toronto FC’s attack worked last season, which was a lot of “give it to Pozuelo and pray he makes something happen.” One question you could ask is: why not look at a percentage of team g+ burden, the same way we did with action usage? There are a few ways to think about it: 1) If a player receives a burden, adds value to it, then passes it on to someone else, maybe it’s not true they were used “less”. For example, if Pozuelo gets on the ball in a +0.1 situation, that is a 10% chance of scoring, and successfully moves it to +0.2 situation, a 20% chance of scoring, his “usage” would look like 0.1/(0.1+0.2) or 33%. Whereas if he had failed the pass and ended the possession, his usage is 0.1/0.1=100%, despite the situations being identical from a Pozuelo usage standpoint. 2) This could be very heavily inflated by teams who create little value in general, where the player gets on the end of valuable possessions but their team is so bad they just don’t get into advanced positions often. Either way, the percentage of team g+ consumed is there and you can look, Pozuelo is third.
So what does this mean? Is Pozuelo just Russéll Oestebrook? Is he an inefficient creator who benefits from being a super high usage hub? Is that a bad thing? Well, let’s consider some larger trends. First, players who see more of the ball tend to produce more. That’s intuitive. You 1) have more opportunities to create value when you get more of the ball and 2) wouldn’t keep getting the ball if you didn’t create value when you got it.
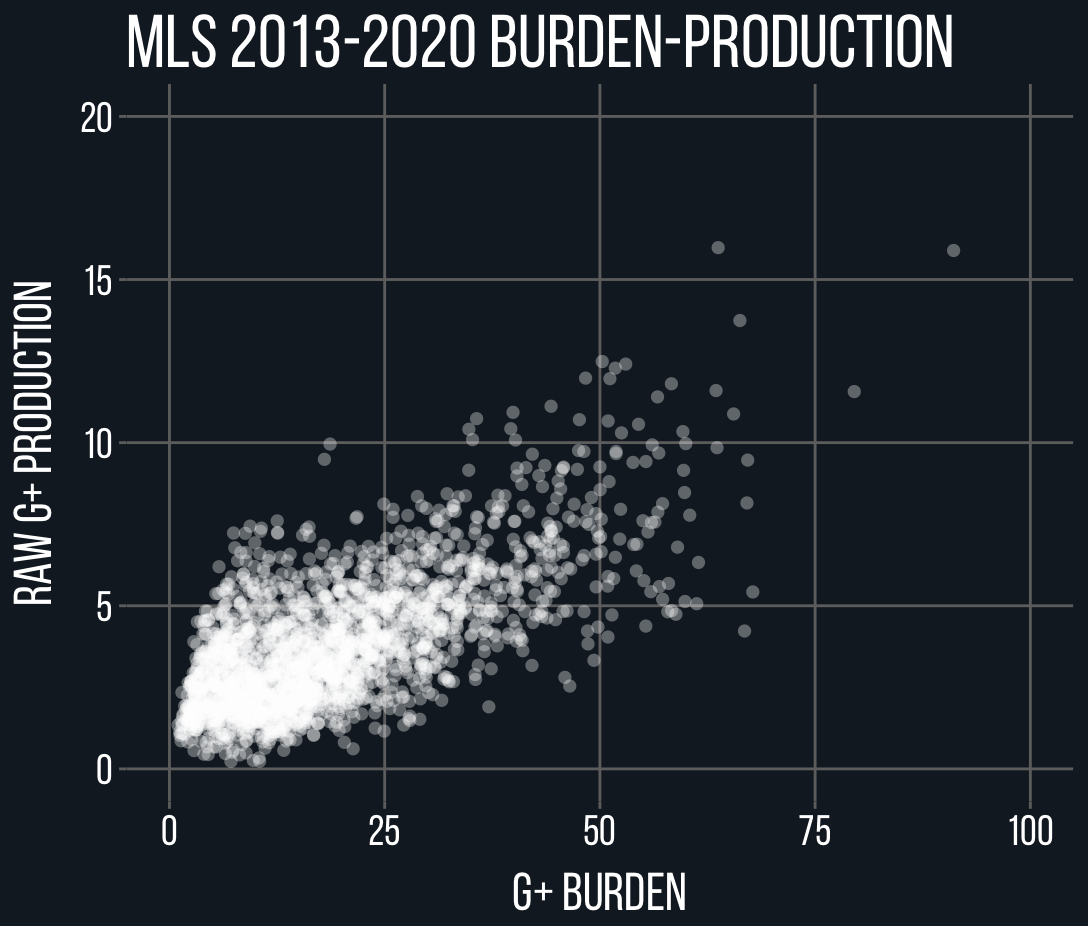
How efficient are these players at actually turning that g+ burden into value? If we plot their raw g+ produced against their raw g+ burden, we can see how “efficient” a player is. That is, for each “goal” of value they start with, how many “goals” do they output? How does that relationship change as they become more and more central to their team’s attack?

Fig. g+ efficiency here is the amount of raw g+ produced per goal of g+ burden. The inlay zooms in on the Bottom right of the main chart.
We can come back to the big cluster of players with 1000 minutes played that have weirdly high efficiencies another time, but, for now, you can see our lovely MVPs from recent seasons in the ASA database. Some are more efficient at capturing burdened value and relaying it into positive actions than others, but there is an undeniable decrease in efficiency as you take on more and more burden. On a per 96 minutes basis, this year’s Alejandro Pozuelo is the 3rd highest usage season ever, behind God-King Carlos Vela and 25-million-dollar-man Miguel Almiron.
The crux of the issue is Pozuelo’s efficiency; at a mere 10%, it becomes difficult to get the volume required to have a g+ value reflecting the positive work he does. When you compare that to Vela, at nearly 18% and an even higher g+ burden, it’s no surprise he put up one of the most statistically dominant seasons ever. This is one of the nice benefits of a possession value framework like g+ (or VAEP, PV+, EPV, etc.), it is really difficult to assess the cost-benefit analysis of high leverage passes like the kinds that these high usage players are required to make. But evaluating it on a usage adjusted basis lets us make accurate determinations beyond what we see. Consider all passes with an absolute g+ value of greater than 0.02, that is, any passes that increase (or decrease) a team’s probability of scoring (or conceding) on this possession by 2% or more. Pozuelo racks up the second most positive passing value from these “home run” type passes, but he also accrues the most negative value by a distance. When you only consider the successful progressive passes and passes into the penalty area, he’s a star, but when you consider the lost value of all of his failures, the “net” value being added is a lot less than might be perceived.
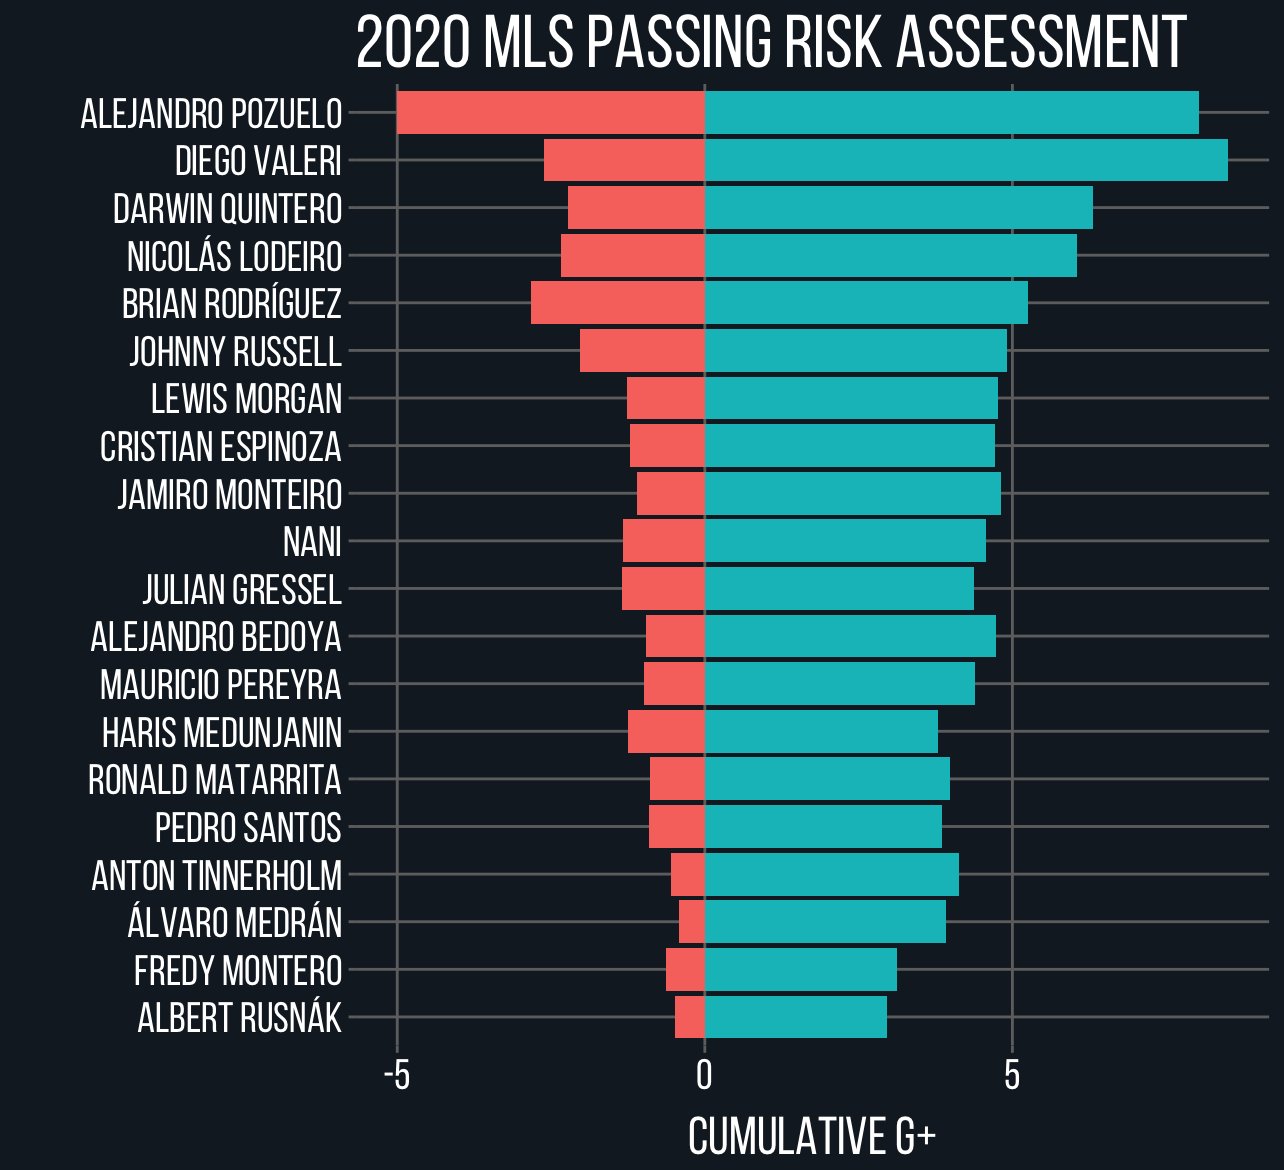
Fig. Pozuelo trails only Valeri in terms of positive passing value, but is far and away the league leader in passing value lost.
What did we learn?
Alejandro Pozuelo was really, really good but he was also one of the highest usage attackers in MLS history.
The degree to which TFC’s entire attack ran through Pozuelo allowed him to rack up more traditional counting stats (G, A, xG, xA, progressive passes etc.), although fairly inefficiently.
Value-based usage is much more informative than action-based usage in soccer.
High-risk home run passes are important to a high-functioning attack, but it’s important to consider the failures.