

The Replication Project: Is xG The Best Predictor of Future Results?
/Over the last decade or so, various scientific fields have been in what has been termed a replication crisis. For a multitude of reasons, when people have tried to reproduce published research they are unable to. Studies with surprising or novel results are often unable to be replicated and even if they are found to be mistaken often continue to be cited far more than the work that debunks them. As a response, scientific research is increasingly open with regards to methods and data in the hopes that this additional information will allow others to faithfully replicate the work. While this scientific replication crisis can have profound effects for policy and public trust in science, as a reader of American Soccer Analysis, you are surely thinking about if this also applies to the field of soccer analytics as well.
This is the first article of what we are terming The Replication Project where we take an important soccer analytics finding from yesteryear and see if it still holds up with modern data. While this can be just a straightforward replication, it can also lead down some rabbit holes as you will find in this first installment where we look at whether the claim that xG is the best predictor of future performance still holds up.
On January 5, 2015 Sander IJtsma, 11tegen11 on twitter, published one of the seminal blog postings in soccer analytics history “The best predictor for future performance is Expected Goals”. While no longer available on the original 11tegan11.com site, it was fortunately preserved by the Internet Archive’s Wayback Machine. This was the early days of xG, and IJtsma and Michael Caley were both showing that xG was a better predictor of outcomes over the course of a season, half a season, and to retrospectively predict game outcomes compared to other metrics like total shots ratio (TSR), as discussed by James Grayson back in 2011. What made IJtsama’s 2015 post revolutionary was that instead of looking at a whole or big chunk of a season, it looked at how xG and other metrics correlated to future results on a game by game level.
The results were better than an xG proponent could have hoped for. Using data from the 2012/2013 and 2013/2014 top 5 European leagues as well as from the 2013/204 Eredivisie, it showed that xG had the highest peak correlation to future points per game than shots on target ratio, TSR, goals ratio, or points per game. Even better, it zoomed ahead of the others. xG ratio was as predictive of future results after five games than goals ratio ever was, and it maintained a decent advantage over then leading metrics like TSR.
This was a groundbreaking result. If you’ve ever heard or read someone say that it takes 5-10 (4 in the article) games for xG to be predictive, they probably read this article or got it second hand from someone who has.
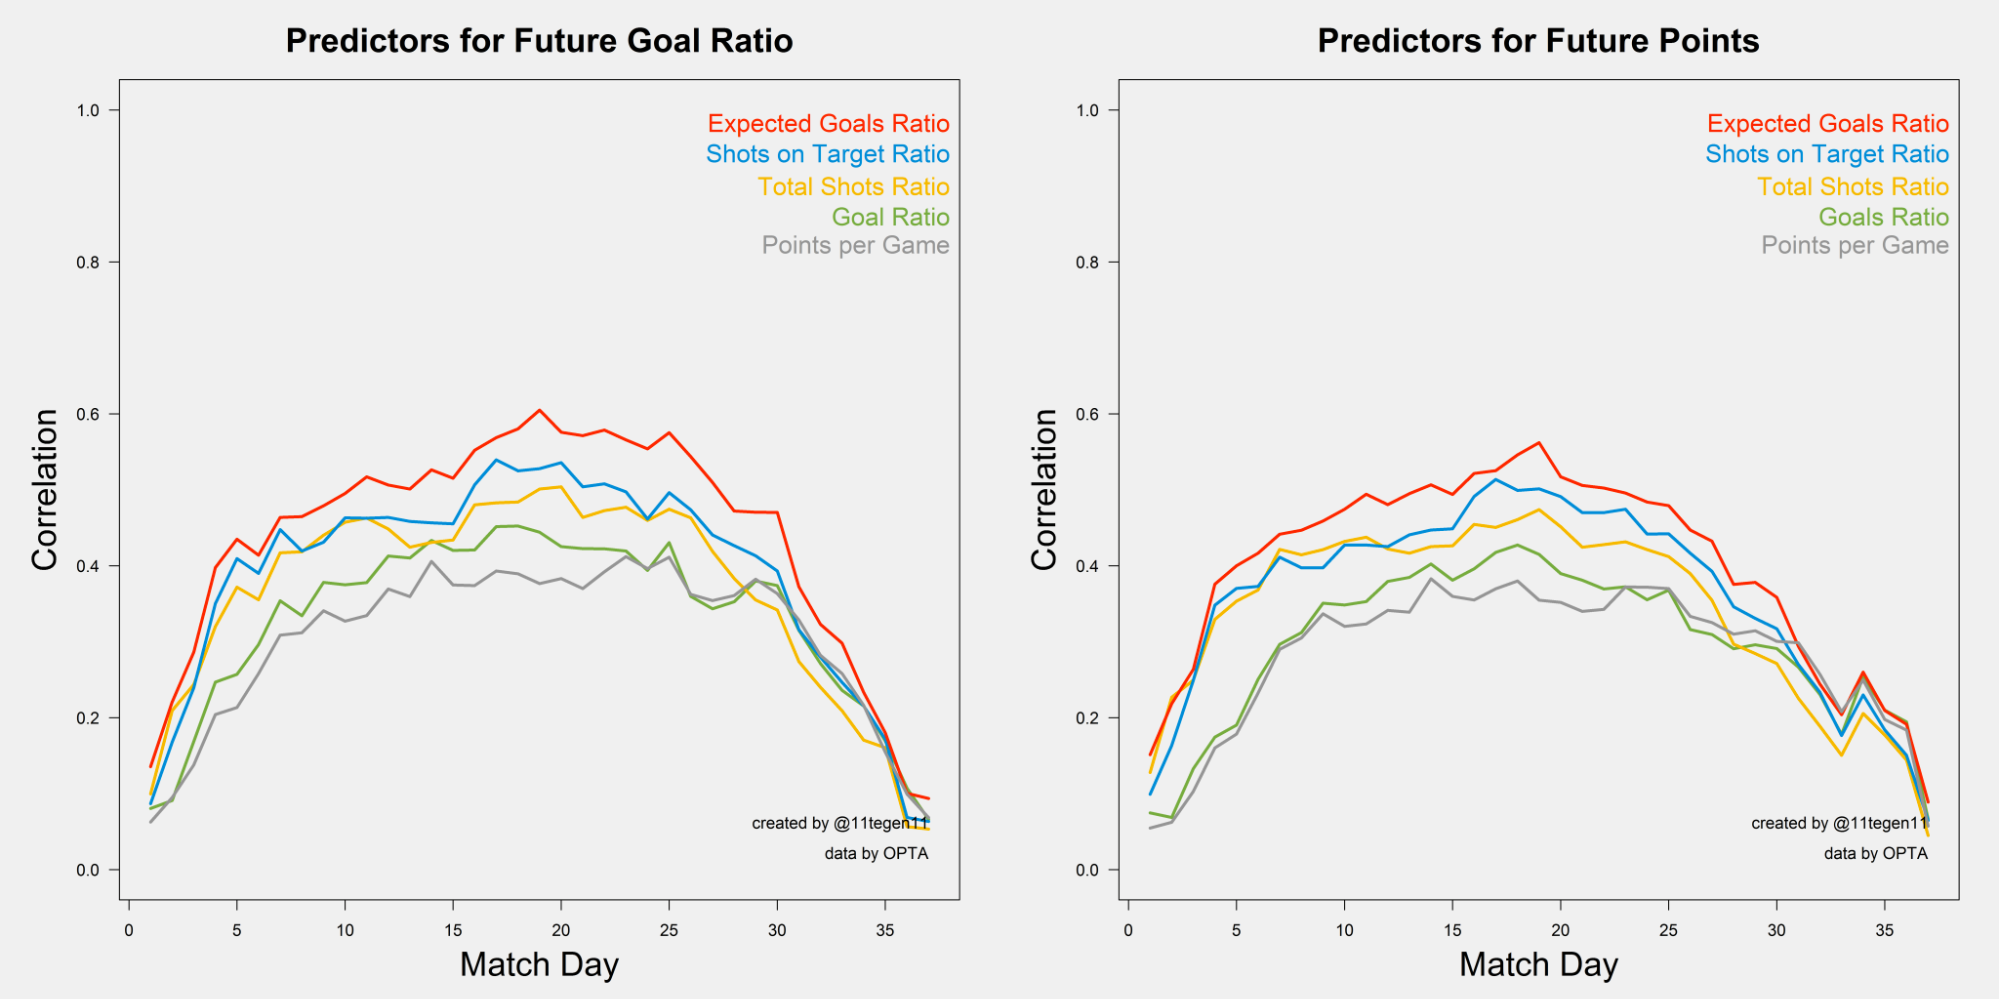
The methods used to generate these plots was clear, making replication pretty straightforward. While the data that IJtsma used back in 2015 is not readily available, it is available from StatsBomb and FBRef for more recent seasons. Using game by game data from the Top 5 European leagues since the 2017/2018 season (14,608 games) and the MLS regular season since 2018 (2516 games), and ignoring the Covid seasons of 2020, I got the following result:

First off, MLS is weird (we’ll come back to this at length). So I split it off from the European leagues. Second, looking at the European curve, xG is still the best predictor of future points with approximately the same curve as that from 2015. However, the rest of the metrics were both not as clean differentiating from the “dumb” metrics like points and goals and the “smarter” ones like TSR and shots on target ratio. Additionally, the correlations between the non-xG metrics were also higher than those seen in 2015, ending up much closer to that of xG.
One of the problems with soccer analytics in general is sample size. In this case 34 or 38 games is not really enough to get a good handle on predicting future points. However, we can do something similar to bootstrapping to get a larger sample size by repeatedly randomly reordering each game within a season for each team. I did something like this before when goals added was released. If you take 1,000 randomly ordered seasons from the same data and do the same analysis you get this:

This way you get smoother curves that, assuming there aren’t huge changes in team composition or schedule effects across a season, probably gets you something more like the actual truth of the correlation of these metrics to future points. The little David Bowie lightning bolt remains due to Germany only playing 34 games. Again, xG ratio is the best predictor of future points at all points of the season. And again, there is not the clear progression of metrics seen by IJtsma back in 2015. And finally, MLS is just way less predictable than the top 5 European leagues, however when mixing up the game order xG does come out on top.
So what’s this all mean?
The IJtsma precedent holds, and xG ratio is the best predictor of future points at any time during a season.
While xG ratio is better, the difference in correlations is not as high in 2018-2022 data as it was in the 2012-2014 data set. This is consistent with recent work by Gabriel Anzer and Pascal Bauer (see figure 4). In the older data, xG was superior to points per game after only 4 games, while with the new data it is 8 games for Europe and 7 for MLS. Still not bad
There is not a clear difference between shot based and results based metrics, and shot based is not necessarily better than points or goals in the recent data compared to 2015.
The top 5 European leagues are much more predictable than MLS for every metric.
While it is good for xG apologists like myself that xG came out on top, with modern data and some heavy simulation, it is not quite as clear cut as it may have seemed in 2015. Also note that Howard Hamilton looked at this in Argentina for 2015 and 2016 and did not see xG being superior and was similar to what we see in the non-bootstrapped MLS plot. Additionally, these Argentinian seasons included unbalanced schedules like MLS.
The big question for us at American Soccer Analysis is why xG predicts future points so much better in the top European leagues than MLS? Stay tuned as we venture deeply down that path in our next article in The Replication Project.