You say you want a Revolution? Possession with Purpose From a Different Angle
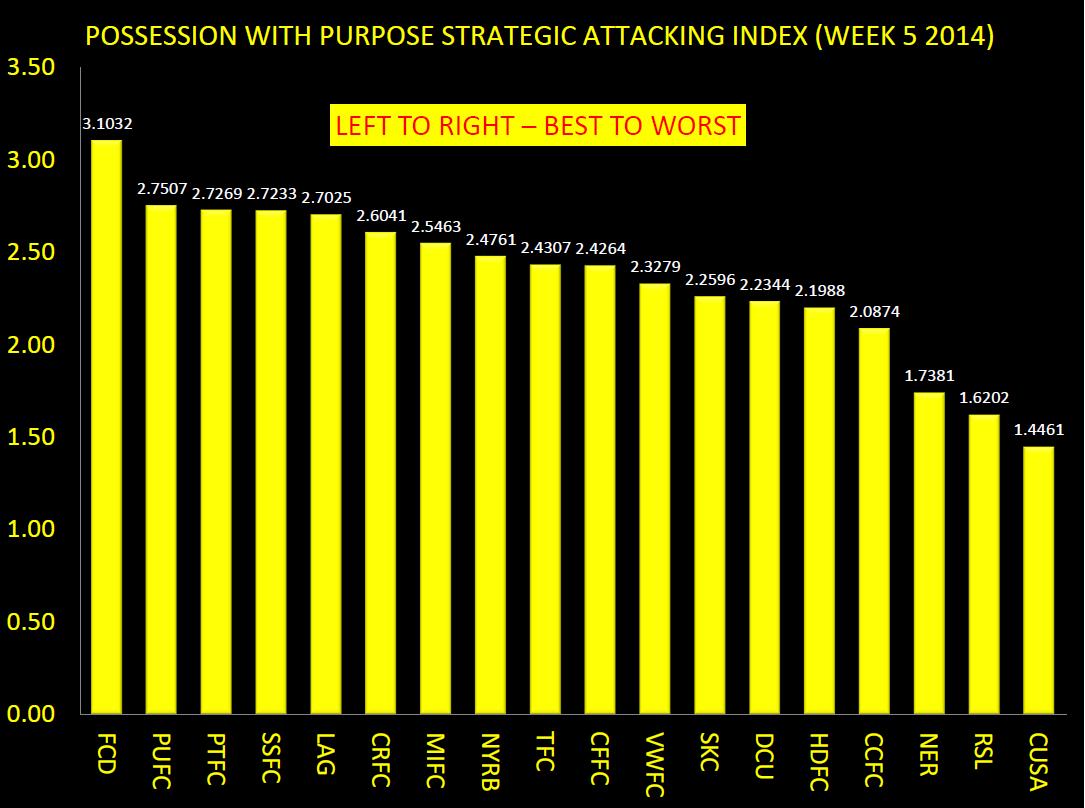
A superb run with five wins and a draw in six games; by most standards that is a compelling argument for consistency.  I agree and their overall Composite Possession with Purpose Index rating continues to climb. They've (New England) climbed from 17th in PWP (week 5) to 7th after week 11; a superb shift of 10 full places in 6 weeks.

So in considering this giant push forward I'd like to take a different approach in how the data points from PWP can be viewed.  

This is new so please bear with me for a minute or two as I set the context.

Below are a number of diagrams referencing my PWP indicators for a few teams; the diagram being used this time is the 'doughnut' diagram from Microsoft Powerpoint.

The interesting thing about this diagram is that it allows me to offer up a view on my PWP data points that isn't relative to the exponential relationship (a line). Instead, it allows me to picture the overall tenor of PWP data points in relationship to themselves as being a part of a 'whole'; with the 'whole' being PWP.

I feel confident I can take this approach since my Expected Wins 2 correlation for my data points is ~.97 (R2) --- as near to rock solid as you can get.

Other context points include:  

  • The teams used in this analysis are Seattle, New England, Montreal, Portland and last years' Supporters Shield winner (New York) plus last years bottom dweller (DC United)
  • Reminder in case my explanation was a bit wordy above - the percentages indicated in the doughnut are not the percentages of those activities relative to the game; they are the percentage of those activities relative to each other with 100% being all those activities added together.
  • Source - as usual the MLS Chalkboard and the MLS Statistics Sheets
  • Gold Stars on the diagrams are intended to show you where differences occur.
  • The team name on the outside of the doughnut is the outer ring of data and the team name on the inside of the doughnut is the inner ring of data.

To begin...

PWP Doughnut Diagram Week 11 NER v MIFC

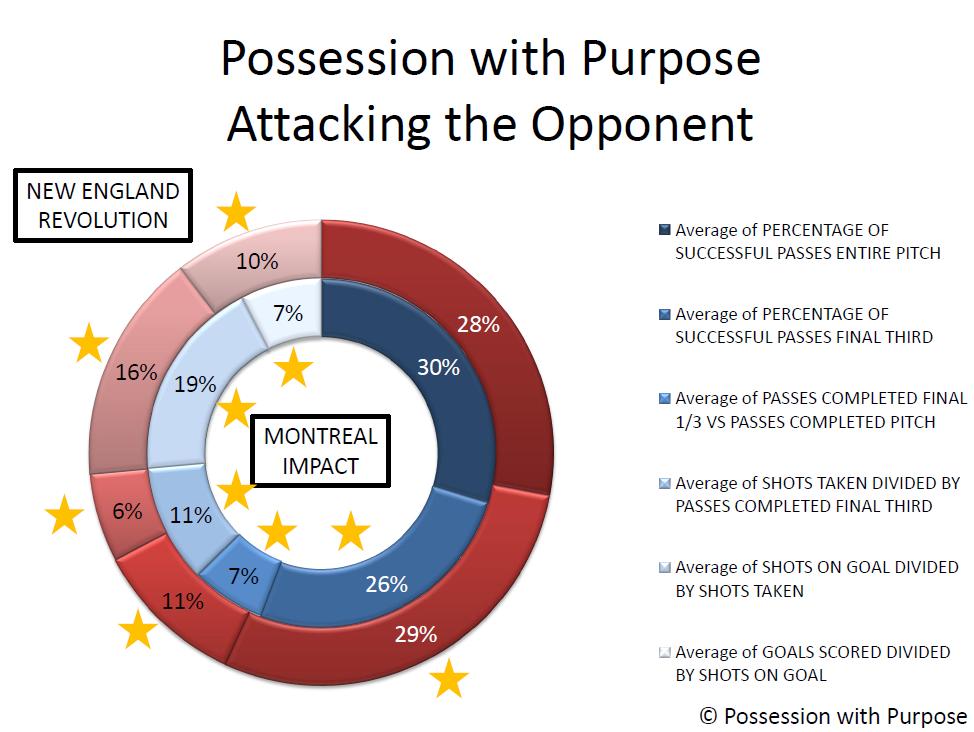
The volume of Final Third passes successfully completed by New England (29%) is 3% points higher than Montreal (26%).  Note also that Montreal has a greater percentage of PWP outside the Final Third (30%) than New England (28%). Both of these indicate to me that New England is more focused on penetrating and creating than Montreal.

For the future I will check into these three areas when looking to see if a 'direct attacking approach' can be better differentiated from a 'ground-based' (short passing scheme) approach.

The actual volume of penetration is higher for New England as well (11%) versus (7%). And like my regular PWP analysis the data here also supports the fact that teams who are more patient in creating shots taken (6% for NER versus 11% for MIFC) end up with more goals scored.

I did ask Matthias Kullowatz about the specific shot data for New England and Montreal; ~60% of Montreal's shots on target have come outside the prime scoring zones 1 & 2 while ~68% of the Revolution shots on target have also come outside of zones 1 & 2.  So what's different?

I think it's down to time and space again; though it could be the Revolution have better strikers - but when you see the DC United doughnut diagram a bit later I think it's back to time and space; and with fewer shots taken and more patience in the final third that seems reasonable to me.

Now for a contrast that might be better at explaining individual mistakes and bad fortune more than a bad 'style/system'...

PWP Doughnut Diagram Week 11 SSFC v PTFC

Notice no 'gold stars'; why? Because there really isn't that much difference between how these two teams execute the six steps of PWP.

What separates these two teams in the league table are individual mental mistakes in defense - Portland sit on ten points while Seattle have 25. Through the course of this year the Timbers have dropped 7 points due to red cards and penalties - they did both against Columbus Saturday night!

In considering the 'sameness' of the data I expect as time passes an output similar to this could highlight 'individual mistakes' and perhaps 'good/bad luck' when it comes to rebounds and deflections - again recall Saturday night when Futty Danso deflected a shot and notched an 'own-goal'

All told things went pretty well for Columbus, a red card by their opponent, a foul in the penalty box by their opponent for a PK and a deflected own-goal by their opponent. If I were a Columbus fan I'd be pretty pissed they didn't win - bad luck for the Crew!

However viewed I'll revisit this diagram later when the Cascadia Cup battle heats up.

So here's the doughnut view of New York compared to DC United last year and then a bit further down how they look compared to each other this year.

PWP Doughnut Diagram NYRB v DCU 2013

First off - let's not forget Ben Olsen was not fired and perhaps this doughnut diagram can also help explain why given the overall poor performance in results last year for DC United.

Notice that the team does exceedingly well in comparison to New York with respect to Passing, penetration and creation; they actually exceed New York in the first two categories and only fall off when it comes to goals scored (7% for DC United versus 15% for New York).

So I'd offer that the system Ben Olsen ran last year worked - what he lacked was a pair of good strikers.  And if you recall the Montreal doughnut earlier the outputs from DC United do not mirror those of the Impact!

They added Espindola and Johnson and shored up their defense a bit; that also included adding Amos Magee to the staff.  Remember him as the Defensive Coordinator for Portland last year (I think - others can confirm or deny that I'm sure)

Bottom line here - the system didn't change and the Head Coach didn't change and I'd offer that was appropriate...  now for the same diagram this year:

PWP Doughnut Diagram Week 11 NYRB v DCU 2014

In closing:

Note the increase for DC United in the final category - goals scored versus shots on goal - pretty compelling information to reinforce that the system used last year is the same system used this year and the difference - major difference - is the addition of two quality strikers.

I'm just in the learning stages on how this new doughnut diagram will take shape - I'm pretty sure it will have at least one hole in it - I'm hopeful there aren't a lot more.

Some changes afoot with OPTA and MLS - I see OPTA incorporated the Final Third Passing Accuracy suggestion - just need to find out if crosses are included in that metric???

As for the new MLS Chalkboard - I'm not sure how that will work if the 'numbers' of activities are not available to count when it comes to defensive activities and 'touches' for players...

And yes, the old Chalkboard still appears to exist given a separate link within previous articles but it's unclear if this change will be a permanent change for next year - or even the World Cup for that matter...

As for This Week in PWP; if you saw my tweets yesterday you know the top Attacking and Defending PWP teams of the week; New England in attack and Toronto in Defense with the Reds taking the Composite PWP Index top spot for Week 11.  

Sporting KC, along with LA Galaxy remain atop the Composite PWP through Week 11 while the Revolution moved to 7th and Columbus dropped to 4th as Real Salt Lake are now in a comfortable position of 3rd best overall.

Finally, this view also gives you and idea of what percentage each team gleans from each of the PWP Six Steps data points in the calculation for the overall Index number.

Best, Chris

Expected Wins #2 - After 184 MLS Events (92 Games)

Hopefully most of you read Part I of my series on Expected Wins in Major League Soccer. As a quick reminder the Expected Wins analysis is my internal data quality review on the seven data points I use to support my quantitative Possession with Purpose analysis; the stronger the correlation these data points have the more confidence I have in the overall Indices that are created to assess team performance.

For your benefit, in case you forgot, here are the seven data points I continue to analyze as we reach the 92 game point in MLS; which equals 184 events:

  1. Passes Attempted Entire Pitch
  2. Passes Completed Entire Pitch
  3. Passes Attempted Final Third
  4. Passes Completed Final Third
  5. Shots Taken
  6. Shots on Goal
  7. Goals Scored

All data points, at this time, have equal weight.

What is interesting is that over the week to week course of the season 40% (20/50) of the weekly top five teams, in Attacking PWP, have averaged less than 50% possession in their matches.  

For me that's pretty cool as it indicates this analysis is not really biased towards teams that use a shorter-passing scheme in attack.  Week 5, 3 of 5 teams were under 50% and the other two were both under 51% possession.

Some of those teams are possession based teams like DC United, Portland and Seattle but in that week the margin of possession did not have as much effect as the ability of those teams to finish quality chances - the top three teams that week all scored goals equal to their shots on goal.

The five teams that week who exceeded 80% in Passing Accuracy; usually a good indicator of ground based attacking all finished outside the top 5.


Moving on after that tidbit, here's the averages for overall (blue bar), teams that win (green bar), teams that draw (orange bar) and teams that lose (red bar).

Expected Wins 2 Averages

Facts as they exist today after 184 Events in 2014:

  • The overall tenor of the data points and their relationship really hasn't changed that much since XpW 1.
  • Teams that win average 51.11% Possession; losing teams average 48.89% Possession, (lower)
  • Teams that win average 76.39% in Passing Accuracy; losing teams average 74.10% (lower)
  • Teams that win average 20.48% Penetration in the Final Third based upon Total Passes completed; teams that lose average 20.32% (lower)
  • Teams that win average 18.64% Shots Taken per pass completed in the Final Third, losing teams average 19.22% (higher)
  • Teams that win average 42.67% Shots on Goal per Shot Taken; teams that lose 32.13% (lower) (by over 10%!)
  • Teams that win average 46.18 Goals Scored per Shot on Goal; losing teams 17.03% (lower) (by over 29%!)

Like after XpW 1 (102 Events - 51 games) losing teams shoot the ball more often, on average, but are less accurate when it comes to putting those shots on target and into the net.  Patience in creating quality continues to outweigh quantity...

Overall, the averages for Shots on Goal for winning teams has increased from XpW 1 (4.90) to XpW 2 (5.36); basically the better teams have gotten better and the losing teams have gotten worse (3.84 now) versus (4.10 in XpW 1).

I wonder how that trend will continue through the rest of this year?

Tthe 2% gap in Passing Accuracy between winning teams and losing teams has held from XpW 1 to XpW 2.

The gap in Shots on Goal has increased in losing teams to 10% as opposed to 9% (XpW 1).

The gap in Goals scored has remained near steady at roughly ~30%; though slightly smaller in XpW 2.

Losing teams still continue to take more Shots than winning teams; 12.74 (winning teams) to 12.80 (losing teams) but... that gap has dropped since XpW 1 - perhaps losing teams are looking to be more patient in their shot selection?

So how does the overall data relate in an Exponential Relationship?

Expected Wins 2 Trend-lines

Observations:

The light shaded lines are the lines of data as in XpW 1 - and the trend-line colors remain the same.

This time the R2 has dropped just a tad.98 to .95 - all things considered most would consider that correlation Rock Solid... I do - and the correlation of these data points, viewed as a whole, have a higher correlation together than Goal Differential (R2 = .88) to Points in the League Table.

Goal differential is usually a great indicator but it also remains a qualitative statistical indicator not a quantitative indicator.

Like last time there remains a difference in the R2 between winning teams, teams that draw, and losing teams; with draws now having greater correlation than wins.  Why?  I'm not sure - but as noted by the closeness of all the data points there still remains a fine line between winning, losing and drawing.

Last time I felt that helped explain the difference between mistakes or unlucky breaks - I continue to sense that is the main difference.  So might this be an indicator of luck - I don't know - what do you think?

I have seen discussions of late, on Telly, and in some articles written elsewhere, that focus more on 'space available' as opposed to just Shots Taken...  hopefully that trend continues!

I also remain hopeful that OPTA and other statistical web sites will offer up more critical events taking place in the Final Third...  One other article written since XpW 1 is my analysis (as promised in Xpw 1) on defensive indicators; here's a link to Hurried Passes and those details.

In closing:

I still don't have enough data, in my opinion, to offer additional thoughts on individual team performance relative to home and away games; that probably won't have statistical reliability until the midpoint of the season (game 323 - events # 646).

There are trends but I'll save that for another article, enough for now.

Best, Chris


Dynamo Dynamic in Attack and Bulls Bullish on Defense - Week 9 Ends in MLS

Taking a team to L.A. and winning 4-1 sounds incredible until you offer up the caveat that it wasn't against the Galaxy. The doormat this year seems to be shining earlier than last. The Houston Dynamo have dominated in dynamic fashion; wow - good on you Giles Barnes...

So how exactly did that powerful attack look compared to other four-goal outbursts this year - was it really that special?

In all the four-goal games this year, here's a quick breakdown on which teams accomplished that and then who's been tops in their Possession with Purpose and Expected Wins statistics for those games:

  1. DC United vs FC Dallas
  2. Sporting KC vs Montreal Impact
  3. Seattle Sounders vs Colorado Rapids
  4. Seattle Sounders vs Portland Timbers
  5. New York Red Bulls vs Houston Dynamo
  6. Houston Dynamo vs Chivas USA
  7. Houston Dynamo vs New England Revolution
  8. Portland Timbers vs Seattle Sounders
  9. Vancouver Whitecaps vs New York Red Bulls

Tops in overall possession in those high scoring affairs was DC United at 67.04%. Tops in passing accuracy across the entire pitch was, again, DC United at 84.17%.

Tops in penetration percentage based upon passes completed in the final third vs. across the entire pitch was Houston vs. New England at 28.94%.

Tops in percentage of successful passes within the final third was Vancouver at 74.55%. Tops in shots taken compared to passes completed in the final third was Houston vs. Chivas USA at 39.13%.

Tops in shots on goal compared to shots taken was Vancouver at 71.43%; and finally... tops in goals scored vs. shots on goal was FC Dallas at 100% versus Houston.

So while Houston did well this weekend, and got their second four-goal game, it wasn't dominating compared to others - sorry Houston. It was three points (which is the target) but it wasn't really that special when viewing who you played against... more later on just how weak Chivas are in Possession with Purpose.

However viewed, Houston still had the best attacking outcome this week. So here's my PWP Attacking Player of the Week... Giles Barnes.

PWP Attacking Player of the Week 10

Moving on to the Defensive side of the pitch - FC Dallas saw red this past weekend and it wasn't just their kit, the Red Bulls kit or Dax McCarty's hair - it was Watson (elementary my dear) who got red.  

Things don't get better for Dallas either - they travel to Seattle for a midweek clash this Wednesday and then must fly down to San Jose for another on Saturday... wow.   Might we see Dallas drop three in a row?  I'm not sure and if you want to know my MLS picks for this week check here.

Anyhow, I digress - the PWP Defending Player of Week 9 is Jamison Olave...

PWP Defending Player of the Week 10

So was that a worthy three points for New York and should it have been expected?  I'm not sure and here's some information to consider:

Below is a list of games, this year, where the first team listed got a Red Card:

  1. DC United v FC Dallas
  2. Columbus Crew v DC United
  3. Columbus Crew v Sporting KC
  4. Sporting KC v Columbus Crew
  5. Sporting KC v New England Revolution
  6. Sporting KC v Real Salt Lake
  7. FC Dallas v Chivas USA
  8. FC Dallas v DC United
  9. FC Dallas v New York Red Bulls
  10. FC Dallas v Portland Timbers
  11. New York Red Bulls v Philadelphia Union
  12. Houston Dynamo v FC Dallas
  13. Houston Dynamo v Philadelphia Union
  14. Chivas USA v Houston Dynamo
  15. Chivas USA v San Jose Earthquakes
  16. Chivas USA v Seattle Sounders
  17. Chivas USA v Vancouver Whitecaps
  18. Portland Timbers v Colorado Rapids
  19. Portland Timbers v FC Dallas
  20. Vancouver Whitecaps v Colorado Rapids
  21. Colorado Rapids v Portland Timbers
  22. Colorado Rapids v Sporting KC
  23. Montreal Impact v Philadelphia Union
  24. Chicago Fire v New England Revolution
  25. Chicago Fire v Portland Timbers
  26. San Jose Earthquakes v Colorado Rapids
  27. Seattle Sounders v Columbus Crew

Twenty seven in all and only Colorado, New York, FC Dallas twice, Sporting KC and DC United won games yielding just a 22% chance of winning when seeing Red.

FC Dallas and Chivas USA lead MLS having received Red Cards in four games.  But here's where the more later comes in for Chivas - check this out.

FC Dallas (when short handed) have an Attacking PWP Index = 2.3976.  Their Defending PWP Index = 2.3914 and their Composite PWP Index = .1472.

By contrast, the Goats PWP Indices (at full strength this year) for Attacking = 2.1685; for Defending = 2.5446 and for Composite PWP = -.3760.  If I were a Chivas USA supporter that is a pretty depressing statistical output - FC Dallas, short-handed, are more productive in Attack and more effective in Defense than a full-strength Chivas... wow!

In circling back to my question on whether or not it should have been expected that New York would win?   Perhaps now, seeing how effective FC Dallas is, even when short-handed, it wasn't quite the cake-walk one would expect.  Key for Dallas these next 7 days will be the health of Diaz and the discipline to minimize Red Cards...

In closing...

After nine full weeks of MLS here's how things stand with my Composite PWP Index along with a few quick thoughts plus the Top 3 in Attacking and Top 3 in Defending.

PWP Cumulative Composite Index through Week 10

LA Galaxy remain atop the table even with their 1-nil loss in Colorado - if Robbie Keane hits that PK, LA doesn't drop one point.  As for Columbus they drop down to 3rd with Sporting KC pushing up to spot #2.

Seattle, FC Dallas, Colorado and Columbus still stay in the top 6 while RSL continues to move forward - inching one space higher into 7th with New York and New England swapping places.

Note DC United dropped a few places and the bandwidth between the Revolution, United, Union, Whitecaps, and Portland got a bit tighter while Houston pushed forward past both Montreal and Chicago after thrashing Chivas.

Settling into last is Chivas, by a large margin, while the Fire and Impact hover on the low end as well...

Did a change in Managers (Head Coaches) really make a difference when looking at the End State? I'm not sure; for now it doesn't appear that either Klopas or Yallop have really changed things up when viewing the bottom line...

The top three teams in overall Attacking PWP (after 9 full weeks) are FC Dallas, Seattle Sounders, and Columbus Crew - can their approaches in possession continue to keep them there?

The top three teams in overall Defending PWP are Sporting KC, LA Galaxy and New England Revolution - some might offer elsewhere that it is surprising to see the Revolution somewhat higher in the table compared to others; is that surprising?

I don't think so... they have shown pedigree in defending for over a year now and with an improved attack it only stands to reason that their overall position finds them where they are...

Finally, have you made adjustments in your Fantasy teams yet?

If not and you are looking for a consistent (team back-four) you may want to add the Revolution to your list while spending a bit of change in leveraging Lloyd Sam from New York (cheap and cheerful) or latching on to Jaoa Plata if you haven't already...

Best, Chris

PWP-Pick-List Week 10 - weaving Expected Wins into my predictions this week...

A different approach this week just to see how things go.  Instead of leveraging my PWP Indices this week I'm going to leverage my Expected Wins analysis this week. Last week I was 5/9 so my running total on my PWP-Pick-List is 51%.

As background - most teams have had roughly an equal amount of home and away games - the Expected Wins #'s are the R2 values relative to playing either at home or on the road.  It's not 100% enough games but it'll do as a test of sorts...

The higher the number the more effective the team has been in overall Possession, Passing Accuracy, Penetration, Shots Taken, Shots on Goals and Goals Scored... the R2 below does not take into account the points earned (i.e. - those numbers do not reflect points won or lost in the league table)...

So in quick fashion (offering up only wins or losses - no draws) here's my picks for games beginning Wednesday and ending on Sunday:

Canadian Cup Vancouver visits Toronto:  Expected wins Toronto .9979 at home and Vancouver .9997 on the road.  Have most MLS teams twigged onto the 'mistake driven' attack by Toronto where possession really has no meaning?  I think so...  Nelson has, as I've intuited earlier this year, imported a European style of football to MLS. Chelsea has seen some success but has failed to take the EPL Championship.  Is this system good enough to get Toronto in to the Playoffs? I'm not sure  - for now I pick Vancouver winning. 

Houston at home to Columbus: Expected wins Houston .9993 at home and Columbus .9996 on the road - Columbus would normally be favored but with Will Trapp sitting on a Red Card I pick Houston winning.  Besides - it is still early days for Berhalter's system and Kinnear knows it well enough having just played Portland while also playing against Sporting the last few years...  I think the width of Houston is better...

Canadian Cup - Edmonton at home to Montreal:  Expected wins for Edmonton (no idea) and Montreal .9993 - Montreal wins given their budget and higher quality players... if they don't win - wow - they really aren't any good...

Seattle at home to FC Dallas:  Expected wins Seattle .9992 at home and FC Dallas .9990 on the road - Seattle wins; especially with Watson on a Red Card.

San Jose at home to Colorado:  Expected wins San Jose .9989 at home and Colorado .9996 on the road.  Colorado has done extremely well on the road this year averaging 1.25 goals per game - they have speed and the back-four for San Jose doesn't... why on earth Goodson continues to be a potential selection candidate for the World Cup I don't know...  maybe he proves me wrong this game.  For the USMNT sake I hope so...  for now Colorado wins...

Philadelphia at home to DC United:  Expected wins Philadelphia .9996 at home and DC United .9985 on the road; A rough patch for the Union of late and Hackworth is probably pretty hacked off by now - for no other reason than the Expected wins favors the Union I think Philadelphia wins...

Montreal at home to Sporting KC:  Expected wins Montreal .9979 at home and Sporting KC .9998 on the road - Montreal took advantage of a disjointed Union two weeks ago and they may consider have to play some stronger players to ensure a good result against Edmonton.  That and Sporting probably being very upset about dropping three points in New England sees Sporting KC  winning... besides, with Zusi and Besler being away with the USMNT later this year these early games really are pretty important for them.

New York Red Bulls at home to Chicago Fire:  Expected wins New York .9999 at home and Chicago .9996 on the road -The Red Bulls are almost at full strength - Cahill got minutes in their Red Card tainted win in Dallas and it's not likely they will be shut out against a Fire defense that's really watered down again this year - New York Red Bulls win...

Columbus at home to Vancouver:  Expected wins Columbus .9996 at home and Vancouver .9997 on the road - I'm convinced Columbus can play possession based football but can they do it consistently and can they take on a Vancouver team that is pretty powerful in attack?  I'm not sure they do that this next weekend.  So this might be an upset by many but I pick Vancouver to win...

San Jose at home to FC Dallas:  Expected wins San Jose  .9989 (subject to change given another home game earlier in the week) and FC Dallas (also with another away game earlier in the week) .9990 - I suppose San Jose has to put together a run of wins sooner or later - my guess is that it doesn't happen here - the attack, if Diaz is healthy is just too strong and the back-four, as noted before, is simply too slow - even with Watson having to sit with a Red Card against New York...  (edit - Watson sits against Seattle) FC Dallas wins...  that doesn't mean San Jose can't score in this game - Dallas remain weak at the back and that might be the telling downfall for Dallas again this year when push comes to shove...

Portland at home to LA Galaxy:  Expected wins Portland .9953 at home and LA .9999 on the road; LA has higher Expected Wins but Portland are improving and LA just lost on the road to Colorado - tough game here and if I had to pick a draw this week it would be here.  For now, unfortunately my Expected Wins indicates LA with a win but I will go with Portland to win.

Colorado at home to Chivas USA:  Expected wins Colorado .9983 at home and Chivas .9997 on the road.  Another one going against the grain based upon Expected wins - I just don't see Chivas winning this game no matter how well their attacking data points relate to each other...  besides speed kills and Colorado has speed up top with Brown... Colorado wins

New England at home to Seattle:  Expected wins New England .9990 at home and Seattle .9997 on the road.  A true test for New England in matching their solid defense against one of the most potent attacks in MLS - an early statement game, in my opinion for the Revolution.  They took it to Sporting KC against the odds at home not too long ago and this one will be a test as well.  For now I have more confidence in the attack of Seattle creating and scoring more goals than the defense giving away more goals to New England... Seattle wins...

Houston at home to Real Salt Lake:  Expected wins Houston .9993 at home and Real Salt Lake .9997 on the road.  Jaoa Plata has shown his value this season and his pairing with Saborio is simply dangerous - that coupled with the strong Diamond midfield makes RSL very hard to beat anywhere.  And with Houston having a game earlier this week I see RSL taking three points...

Best, Chris

"Hurried Passes" - Could this be a new Statistic in Soccer?

Aye... the NFL track 'hurried throws' -  why doesn't a Statistics agency involved in Soccer track "Hurried Passes"? I'll get to that but first I need to set some conditions.

If you've read my article on Expected Wins  (XpW) it seems reasonable that a teams' Passing Accuracy in the Final Third has great value in working towards generating quality shots taken that are more likely to be on goal and (therefore) more likely to go in.

So what activities does the defense take to mitigate successful passes (i.e. generate Unsuccessful Passes)?

Before digging in, I'm not the only one on American Soccer Analysis looking into Defensive Statistics; Jared Young has put together an interesting article on Individual Defensive Statistics that may be of interest.

Similarities in our work come from collecting 'like' defensive activities; Tackles Won, Clearances, Interceptions, etc...

Additional twists in my efforts will be to fold my Opponent team attacking statistics in with my team Defense Activities to see what correlations might be present.

My data comes from the first 71 games in MLS this year (142 events) and my source is the MLS Chalkboard.

Bottom line up front (BLUF) - however this data plays out it needs to make sense so here's my operating conditions on Team Defensive Activities in the Defending Final Third and which ones I will focus on that can be associated with an Unsuccessful Pass in the Final Third:

  1. Recoveries - usually associated with 'loose balls' generated from some other activity like a deflection, rebound, or perhaps an unsuccessful throw-in that hits a head and deflects away (uncontrolled) that another player latches on to and then makes a move showing control the ball.  Therefore Recoveries are not counted as a specific defensive activity that would impede a successful pass - it is the resultant of another activity that impedes a successful pass.
  2. Clearances - one of the better examples of a defensive activity that impedes a successful pass - especially those generated from crosses but not necessarily called a blocked cross.  Therefore Clearances will be counted as a specific defensive activity that impedes a successful pass.
  3. Interceptions - pretty much self explanatory - an interception impedes a successful pass - therefore Interceptions will be counted as a specific defensive activity that impedes a successful pass.
  4. Tackles Won - this is a defensive activity that strips the ball from an opponent - so it is a possession lost but not a defensive activity that impedes a successful pass.  It won't be counted as a defensive activity that impedes a successful pass.
  5. Defender Blocks - this is a defensive activity that blocks a shot taken not a successful pass; therefore it won't be counted as a defensive activity that impedes a successful pass.
  6. Blocked Crosess - clearly it is what it is; and since a cross is a pass it will be counted as a defensive activity that impedes a successful pass.

To summarize - Blocked Crosses, Interceptions and Clearances will be counted as defensive activities that should impact the volume of Unsuccessful Passes.

So what are the correlations between those combined Defensive Activities versus Unsuccessful Passes after 142 events?

Final Third Defensive Activities to Unsuccessful Passes = .6864

Final Third Defensive Activities to Unsuccessful Passes when the Defending Activities' Team Wins = .7833

Final Third Defensive Activities to Unsuccessful Passes when the Defending Activities' Team Draws = .6005

Final Third Defensive Activities to Unsuccessful Passes when the Defending Activities' Team Loses = .6378

In conclusion:

It seems pretty clear that Teams who win have more Defensive Activities, that in turn increase their Opponents' Unsuccessful Passes given the higher positive correlation than losing teams - in other words a team that wins generally executes more clearances, interceptions and blocked crosses to decrease the number of Successful Passes their Opponents make.

It also seems pretty clear that all those Defensive Activities don't account for the total of Unsuccessful Passes generated by the Opponent.  If they did then the correlation would be higher than .7833; it'd be near .9898 or so.

So what is missing from the generic soccer statistical community to account for the void in Unsuccessful Passes?

Is it another statistic like Tackles Won, Duals Won, Blocked Shots or Recoveries?

I don't think so - none of them generated a marked increase in the overall correlation of those three Activities already identified.

I think it is the physical and spatial pressure applied by the defenders as they work man to man and zone defending efforts.

In Closing...

To date I'm not aware of any statistics that log 'pressure applied' to the attacking team.  A good way to count that would be tracking how many seconds the defending team gives an opponent when they recieve the ball and take action.

My expectation is that the less time, given the opponent, the more likely they will hurry a pass that simply goes awry without any other statistic event to account for that other than - bad pass due to being hurried.

So in other words; like the NFL tracks hurried passes, I think that the Soccer statistical community should also track "hurried passes"...

I'm not sure that completely closes the gap between those three Defensive Activities and Unsuccessful Passes but it does seem to be a relevant statistic that can attempt to quantify panic in an attacker while also quantifying good physical and spatial pressure by a defender.  Two relevant items of interest to a coach in weighing the balance on who plays and who doesn't and who they might like to add to their team or perhaps put on loan/trade elsewhere.

The Official statistic that would get tracked for attacking players is 'Hurried Passes' and the statistic that would get tracked for defensive players is 'Passes Hurried'.

In addition - an increase in hurried passes can become a training topic that drives a Head Coach to develop tailor made passing or turning drills to minimize Hurried Passes (make space) while also providing a Head Coach statistical information to generate tailor made defensive drills that look to increase Passes Hurried.  I'd expect the level of the training drills to vary given the level of skill/professional development as well.

So how might someone define a "Hurried Pass"?  I'm not sure; there are plenty of smarter people out there in the soccer community than me - if I had to offer up a few suggestions it might be a pass that goes out of bounds given defensive pressure, or maybe a through-ball that goes amiss given pressure from a defender - in other words the timing of the delivery looked bad and given defensive pressure it was off-target.

However defined if judgment can be applied when identifying a pass as a key pass then it stands to reason that judgment can be applied to identify a bad pass as being bad because the defender hurried the attacker.

More to follow...

Best, Chris


Cumulative PWP: Four-Horse race to the Shield?

Early indications show it may be at least a four-horse race (at the near quarter-mile post) with FC Dallas, Columbus, Sporting, and LA leading the way. Other favorites as Week 8 begins should include Colorado, Seattle, Real Salt Lake, and maybe a real sleeper (statistics wise) Toronto.

Note any early-season favorites missing? The obvious here are the two incumbent conference champions, New York and Portland. Defensive woes highlight their early season takeaways.

New York's stategy last year (get more goals than the opponent) has only worked once this year and Portland's strategy, patience and accuracy in their possession with purpose has taken a back seat to the poorly performing back-four. And in this case, even though four goals against come from Penalty Kicks (set-pieces) what that really means is the back-four (and some defending midfielders - Zemanski in particular) have not done their job.

If PWP is new to you here's a link to the Introduction and some explanations - another link that may be useful is my new Expected Wins (XpW) article getting down to the basics - winning and the tendencies of teams that win.

Given the early stages of this horse race, here's my traditional diagram for consideration:

PWP Composite Index Through Week 7

Prime movers this week include LA Galaxy dropping three places with that draw to Vancouver and two goals scored per each team.

Others taking a hit to their Index rating were DC United dropping two places with their hard fought draw against Columbus; Portland with that gut wrenching loss (superb saves by Rimando) away to Real Salt Lake and Montreal - a continued drop of two places after getting spanked by Sporting.

Bottom dwellers continue with San Jose and Chivas moving nowhere - while some might feel keeping Chivas (with a new name) in LA is a good thing I'd offer that moving them out may REALLY help kill the stigma of them simply not being a team that will compete regularly for a Playoff position.

Maybe St. Louis or some other city is better placed to host that organization?

Anyhow, FC Dallas, Columbus (almost by default) and Sporting KC all moved up a notch at the expense of LA while RSL continued their move up the Index as they leapfrogged Vancouver, DC United and Philadelphia.

Bottom line in this is that some teams continue to jockey for overall position but the moves up and down were less dramatic, as a whole, this week, than in previous weeks.  Solid play breeds confidence and confidence breeds success.

In looking at the Attacking side of the equation here's the teams from top to bottom:

PWP Composite Attacking Index Through Week 7

Can anybody really question Pareja's approach in Dallas so far this year?  Probably not - a Toronto side came to town with their brand of away football and came away with nil-pwa.

Of the eight top attacking teams seven of them exceed 50% in possession percentage with Real Salt Lake (49.77%) being the lone wolf; go figure that one?!?  That being said four of their first seven have been away games and three of those four away games saw them at ~49%, 43%, and 45%.

So back to some general indicators on the attacking side - all four of the top teams in attack exceed 40% in goals scored from shots on goal - yet none of those teams is in the top four for Shots on Goal versus Shots Taken; those four teams are Montreal, Real Salt Lake, Vancouver and Sporting.  A trend more noticable in my Expected Wins article...

Teams making the most effective use of penetration into the Atacking Third are New England (~29%), Houston (~24%), Philadelphia (~23%), and Columbus at (~23%).  Bottom dwellers in percentage of total passes inside the Attacking Third are Montreal (~17%), Colorado (~17%) with Sporting and FC Dallas at (~18%).

A good indicator for Portland (based upon last year's averages) is that 18.83% of their possession has been in the Final Third.  What has lacked is controlling individual mistakes and positional play in Defense.

Will Johnson had some frustrated words to offer after that loss in Real Salt Lake (that I won't quote) - hey - give the guy a break - he's a fierce competitor and like most any of these guys he simply hates to lose...  but he's right; professionals get paid to put up their best in tight situations.

If training doesn't help some get better than it's time for personnel changes...

Moving onto Defense and the PWP Composite Defending Index:

PWP Composite Defending Index Through Week 7

Like last year Sporting KC is simply tough in defense; and after 7 weeks of play they have now found themselves leading the pack... about time I expect...

Other top performing defending teams include LA, Colorado, Columbus and New England.  A continued presence by DC United should give warning that Olsen seems to be doing better in stopping their goals-against rot from last year.  Is it Boswell who's made the overall difference?

In looking at the tail end both Chivas and Montreal continue to wallow at the back of the pack while Chicago, under Yallop, can't seem to gallop at full stride yet either.

A few other notables here; FC Dallas, Seattle and Real Salt Lake are in the bottom ten on the defensive side of the pitch - that strategy was an indicator of New York simply outscoring their opponents.

A run of bad luck, shoddy shoes, dodgy goal keeping, or getting hamstrung with injuries could have a huge impact in their overall outputs.

The teams that should scare people the most are Sporting and LA Galaxy... and with Colorado and Columbus looking to gain confidence (and chemistry in their attack) they too may put paid to rest this idea that a team can simply win more games by outscoring their opponent.

That approach got New York the Supporter's Shield last year but not the Championship - I think the teams going for it this year want the Championship and/or first place in their respective Divisions'.

In closing...

The plot thickens as does the muck and the mud on the track at the first turn in this yearly Derby. Hurdles await as does time spent at the World Cup, where the stakes for some players are so much higher than others.

Looking forward to an exciting weekend of MLS, and really wish the DC United match against FC Dallas was televised on National TV!

Best, Chris


Expected Wins in MLS

Over the two and a half years I've been developing Possession with Purpose you've heard me go on about this game not just being about scoring goals it's about winning.  I don't mean that in the sense that you don't need to score goals to win; you do.  But what separates winning from losing statistics wise?  And if there is separation, what is it, and what value does it bring?

I'm not sure I have 'the' answers but I do have 'some' answers...

To begin here are the 7 primary data points I collect and calculate ratios with in my PWP Six Step Process analysis:

  1. Passes Attempted Entire Pitch
  2. Passes Completed Entire Pitch
  3. Passes Attempted Final Third
  4. Passes Completed Final Third
  5. Shots Taken
  6. Shots on Goal
  7. Goals Scored

I collect these data points for every team, for every game; all 646 from last year and up to 102 (61 Games) so far this year.

In looking at the data this year the below diagram offers up the averages of those 7 data points, for all games, up to the end of Week 6. 

The blue bar is the overall Average for all games regardless of points earned, the green bar is the Average for all games where teams took three points, the amber bar is the Average where teams took one point, and the red bar is the Average where teams got nil-pwa.  

Expected Wins PWP Data Points

Facts as they exist today after 102 games in 2014:

The table just beneath the bar graph indicates the raw numbers (averages); for example the average Successful passes for teams that lose (in the Final Third) is 73.13; their average Shots taken is 13.39; their average Shots on goal is 4.10 and their average Goals scored is .58.

Here are the percentages derived by comparing the relationship of each of these points(part of my PWP analysis) working left to right:

  • Teams that win average 50.30% Possession versus teams that lose average 49.70% Possession.
  • Teams that win average 76% Passing Accuracy across the Entire Pitch. /// teams that lose average 74% Passing Accuracy across the Entire Pitch.
  • Teams that win average 71% Passing Accuracy in the Final Third. /// teams that lose average 64% Passing Accuracy in the Final Third.
  • Teams that win average 22% of all their Passes Attempted in the Final Third /// teams that lose average 25% of all their Passes Attempted in the Final Third.
  • Teams that win average 17% Shots Taken vs Completed Passes in the Final Third. /// teams that lose average 18% Shots Taken vs Completed Passes in the Final Third.
  • Teams that win average 40% Shots on Goal vs Shots Taken. /// teams that lose average 31% Shots on Goal vs Shots Taken.
  • Teams that win average 45% Goals Scored vs Shots on Goal. /// teams that lose average 14% Goals Scored vs Shots on Goal.

Observations:

While 2% difference in overall Passing Accuracy might not mean much it should be noted as a reasonable indicator on how well a teams' Passing Accuracy will be in penetrating the Final Third.

That 2% difference translates this way.  When a team makes 500 pass attempts.  76% * 500 Passes equals = 380 Completed Passes.  74% * 500 Passes equals 370 Completed Passes.

Any one of those unsuccessful passes could be the pass that gets you that goal or leads to the Opponent making an interception (quick counter) that gets them a goal.

Perhaps it is easier to understand why some coaches say control of the game and possession adds value?  Those teams that are more accurate in their overall passing are more likely to win.

In looking at Passing Accuracy within the Final Third there is a clear difference between winners and losers; winning teams are 9% better in Passing Accuracy within the Final Third... this is not about volume of passes - it's about the accuracy of those passes.

To put that into perspective say a team attempts 100 passes in the Final Third; 71 of those passes (71%) are successful for the winning team whereas  only 64 (64%) are successful for the losing team.

That difference of 7 (within the tight confines of the Final Third) could make a BIG difference; those 7 extra completed passes could be 7 through-balls, key passes, or crosses that lead to a goal versus no goal.

Note that losing teams take more shots (on average) per pass completed (18%) than teams that win (17%).

Is that an indicator that the less effective team is trying to compensate for lower skill levels/overall passing accuracy by increasing their shots taken totals?  I think so.

And when looking at the ability of a winning team to put a shot taken on goal (a more accurate shot) the winning teams do that 9% better than losing teams.

And that initial accuracy then translates to a huge, if not inordinately large, difference between a team that wins versus loses; 45% of shots on goal are goals scored for winners versus 14% for losers.

Now for the second diagram and the R2 for the overall average, wins, draws, and losses with the backdrop lines being the real numbers for all 102 games this year..

The "x and y" axis represent the same things as they did in the first diagram.  The Blue, Green, Yellow and Red lines represent the averages 'in trend-line format' seen in the above diagram with their corresponding exponential correlations.  

I selected the Exponential Relationship as opposed to a Linear Relationship because I think it best represents the drop off in passes (in total) versus those just within the Final Third; the R2 will remain the same regardless.


Expected Wins PWP Data Points Correlations

Observations:

First off - all those lines are the 102 games worth of data that populate the diagram - it is that data that also formed the 'averages' for the first diagram...

That tight difference in R2 means there is a very tight margin of error between winning, losing and getting a draw; and if you've watched a game you know a single mistake can cost you three points.

However tight, there is a difference between the R2 for winning teams versus losing teams.  Is that statistical difference associated with those percentage differences indicated in the first diagram?

I think so, and while Possession (itself) is not "the" prime indicator on whether a team wins or loses it is "an" indicator that should be considered, when viewing overall passing accuracy within and outside the Final Third.

Perhaps the TV pundits will take more time to show better graphics where the Final Third data (in possession percentage) is separated out from the overall possession data?

Perhaps another view that may be helpful to others is the 'space available' that gets leveraged in creating that goal scoring opportunity?

I don't know if this data is representative for teams in Europe - but the data certainly supports that view for teams in Major League Soccer.

To reinforce the End State (winning) from a different viewpoint. 

Last year the top five teams in volume of shots taken versus passes completed in the Final Third were Chicago, (26%), Philadelphia (26%), FC Dallas (26%), Montreal (25%) and Columbus (23%).

Only one of those teams made the MLS Playoffs - Montreal.

This year the top three teams with the highest volume of shots taken versus passes completed in the Final Third are Montreal (28%), Chicago (28%) and San Jose (26%); two of those three teams are the current bottom dwellers in the Eastern and Western Conferences.

In all this I've not talked anything about defensive play... more later this year on how teams perform without the ball with specific focus on defensive efforts (collectively and by individual defensive action) within the Final Third.

For now I offer these questions:

  • Do you think teams that defend better do so as a team (collectively) or is it individual actions like clearances, tackles, interceptions or recoveries that stand alone?
  • And does the general formation they play to (advertised as 'the formation' in the MLS recaps) show results differently in how a defense performs?
  • And does the relationship of the individual or collective defensive activities relate better to unsuccessful passes in the Final Third?

My intent will be to answer these questions, and more, as the data piles up (figure once the 17 game mark is reached, for most MLS teams, I will have enough to offer a reasonable view on what is and isn't of value.  With respect to the data discussed here - I have the 102 games here and the 646 games from last year.

When circling back to my overall PWP Composite Index - here it is put another way...

  • The Attacking Index is the relationship those seven data points have with respect to the six steps in the PWP Process.
  • The Defending Index is the relationship the Opponents seven data points have with respect to the six steps in the PWP Process.
  • The Composite Index is the difference between those two Indices.
  • This year, at this time, the overall Correlation of that analysis is an R2 of  .7658 - the R2 for Goal Differential is .8729.
  • The R2 for Goals Scored is .5083 and the R2 for Attacking PWP is .5865
  • The R2 for Goals Against is -.6754. and the R2 for Defending PWP is -.6225
  • Bottom line here is that the PWP Composite Index has the 2nd highest R2.  With that you should have a better feel for what goes on behind the scenes to get there as opposed to just looking at Goal Differential.
  • The more data points collected the more relevant the R2.
  • How this plays out by the end of the season is unclear but as a reminder the overall PWP Composite Index was 90% accurate by the end of the 2013 in showing what teams would make the playoffs and what teams wouldn't.
  • And two of the top three teams in the Composite PWP Index for 2013 were in the MLS Championship Finals...
  • Starting for Week 8 my PWP-Pick-List will offer up my prognostications about a team either winning or losing... no more draws will be offered up as no one team ever goes into a regular season game wanting to get a draw.  A draw is good but the intent of a Head Coach is to win first.

In closing...

The repeatable statistic in this effort is wins, draws and losses...

Expected Wins is all about what it generally takes to win a game versus lose a game; it's not about getting a draw.

Expected Goals is an 'effect' relative to Expected Wins and the 'causing' relationship between those seven data points; i.e. the combined effort of a team as it possesses, passes and penetrates with purpose.  Hence my phrase offreed up some time ago "quality beats quantity".

And yes, set-pieces win games, and sometimes the team getting those and scoring from those does that against the run-of-play; I suppose that is why the R2 for wins, draws, and losses is so close.

However viewed, teams play to win and score goals.  Various strategies and tactics may be used depending upon location, game state, game conditions, team formations, player selections, or what's needed to move on, if in a knock-out or other tournament type condition.

It will be interesting to see how this analysis unfolds for the World Cup this year... more to follow... Here is the link on more to follow for MLS this year... Expected Wins 2 (92 games /// 184 events)

Bottom line at the Bottom:  For the MLS, every team wants to win every game - those teams that are more successful in winning are those teams that:

  1. Have slightly more possession,
  2. Have better passing accuracy, 
  3. Have more patience in penetrating the Final Third,
  4. Take slightly fewer shots,
  5. Put more shots on goal and,
  6. Score more goals.

Best, Chris

MLS PWP through 6 Weeks: Does the wheat begin to separate from the chaff?

You might not think that six weeks is enough to begin to categorize what teams are performing well and what teams aren't - I may even agree with you to an extent, but here's the thing: we're six weeks in, and patterns are beginning to take shape. Instead of just showing the combined Index for all 19 teams I'm going to split them up into the Eastern and Western Conferences to show a different view.  And here's my link to the Introduction to PWP.

Here's all the Eastern Conference teams up after 6 weeks (note some teams have yet to play six games):

Eastern Conference PWP Strategic Composite Index Cumulative to Week 6

Observations:

The intent here is to offer up a graphic that shows which teams are performing better in attack than their opponents so far. No intent here to write off anyone, yet... too early for that with 28 games and a maximum of 84 points still being available.

Let's just say that Berhalter and Vermes have their teams in top gear - while Hackworth, Olsen, Petke, Heaps and Nelson are still fine tuning... as for Klopas, Yallop and Kinnear performance needs to get better and I'm sure they already know that.

As a reminder - this Index is the difference between how well a team executes the six primary steps of Possession with Purpose versus how well their opponents execute those same steps against them. A negative number thus means that, on average, the opponent is performing those six steps better (collectively) than that team.

I'm not a betting man yet on this Index, but if you think the odds are good that Columbus wins the Eastern Conference, then a flutter of $20/20 BPS might be a worthy chance. Spreading your bet across the field with Sporting Kansas City and one or two other teams might be worthy as well... for now I'm not seeing Montreal make it; but that's just me.

On to the Western Conference:

Western Conference PWP Strategic Composite Index Cumulative to Week 6

Observations:

Like the Eastern Conference, it's too early to go too deep, and the high flying teams play each other three times this year just like those guys back east; when LA and FC Dallas square off it should be interesting...  all the while Colorado and Seattle continue to get better, with Vancouver and the ever present/haunting Real Salt Lake looking to make a strong mid-year run.

As for Portland - times are hard early on this year and a 15-game unbeaten streak would be a much needed does of medicine to put them into the thick of things. How San Jose and Chivas cope remains to be seen - and given the styles I've seen from them this year, it appears crosses are their primary way to penetrate.

If you're a betting guy, I'm even less sure about the West than the east at this point - for now spreading the bets where the odds are good seems a likely choice with LA probably being the front-runner... is this the year where big money shows value in the West, like New York garnered last year in the East?

As for the top performing PWP attacking teams in general; here's how they compare against each other across all of MLS:

PWP Strategic Composite Attacking Index Cumulative to Week 6

Observations:

While there is no sure thing if you're looking for teams who are more likely to put goals past their opponents in multiples it's likely the top 5-10 teams are those that can - whether they prevent the same number of goals is a different story.

Note Real Salt Lake is in the top 7 here but sits in 6th place overall in the Western Conference PWP - for me that indicates Real are operating pretty much like they did last year; score goals and work harder than your opponent to score more goals while relying on your defense to keep you in the game... without that stoppage time goal by Edu this past weekend it's likely RSL would have been higher up the Western Conference PWP Index.

Note also that Sporting remain in the top ten for Attack - they've always been viewed as a great defending side - the higher up the attacking scale they reach the more likely they will be balanced for another run at the Championship.

On the other end - New England and Toronto are bottom dwellers here but they are getting points; why so low?  In working their own style Toronto have started the season averaging just over 40% of the possession with just 64% accuracy in their overall passing - what we are seeing is timely penetration against opponents who are out of shape, position wise (for the most part) - recall also Defoe has been injured too.

As for New England - their accuracy and possession numbers are solid - where things drop off are their ability to create shots taken (2nd lowest in MLS so far this year) and their ability to convert those shots taken into shots on goal and goals scored.  Their goals scored percentage based on shots on goal is just 12.22%.  That is the lowest goal scoring conversion rate in MLS - and a whopping 56% points lower than FC Dallas - who have converted (on average) 68.33% of their shots on goal to goals scored...

Other notable pieces of information - both Columbus and LA are averaging better than 80% accuracy in 'all' passing totals; the teams doing the best in penetrating based upon total passes are New England (29.49%) with Houston, Columbus, Philadelphia and Chicago all hovering around 22%.  The team creating the most shots given their final third penetration is San Jose at 26%, Toronto at 25% and Chicago at 25% - can you say counter and direct attack (be it on the ground or in the air)?

The teams most successful in putting shots on goal compared to shots taken are Colorado (42%) Real Salt Lake (42%) Vancouver (41%) and FC Dallas at (40%)...

Moving on to the Composite PWP Defending Index...

PWP Strategic Composite Defending Index Cumulative to Week 6

Observations:

Not much separates the good from the not so good and perhaps the ugly; and it's too early to label anyone as really ugly.

For now the team most successful in holding their opponents to low passing accuracy percentages are Sporting KC (opponents just 70.25% accurate per game) with Real holding opponents to 71.97% accuracy, DC United 71.98% accuracy and Philadelphia holding opponents to 71.55% accuracy.

As for allowing penetration based upon overall passes; opponents of San Jose penetrate over 24% of the time while Vancouver also permits opponents to penetrate about 24% of the time.

In opponents completing final third passes the team most successful in limiting completed passes in their defending third is LA at 12% while Toronto's defense offers up a stingy 13.57%.

The teams allowing the most shots taken versus passes completed in their defending third are Chivas at 41.65% and New York at 40.55% - you wonder why I keep harping on New York that's why... they just don't defend that well in their own final third...

Teams yielding the most goals scored per shots on goal, per game, are Chivas at 45% (begging the question: why couldn't Portland score more than one goal?), Philadelphia at 43% while LA Galaxy allows a stingy 17% of their opponents shots on goal converted into goals scored.

In closing...

Just week 6, but patterns continue to develop - as the season unfolds I'll do my best to offer up these tidbits for your consideration.

For the future, I have a post coming up that speaks to formations and defensive activities - still need about 4 more weeks for that one to have enough data to offer some observations on it.

All the best, Chris

You can follow me on twitter at @chrisgluckpwp


MLS Possession with Purpose: The best and worst of Week 5

pwp-strategic-composite-index-week-5-only-e1396975889335.jpg

And so it goes; another week completed where you got the heart-pounding excitement from the Cascadia Cup clash, a defensive struggle from two of the best teams in MLS, and lopsided victories for two others. Before digging in, a couple of links to consider: if you missed the match between Portland and Seattle here are two articles you may want to read if the opportunity presents itself. This one was offered up by MLS, and then here's mine offered up on my home site here in Portland with the Columbian Newspaper.

Also, if PWP is new for you there may be value in reading what that's about through this link, an introduction to PWP and some explanations in case this approach is new to you.

With that out of the way it's time for some grist... who was the most effective and efficient team in my PWP Composite Index this week, and who was the worst?

To set the table here's my standard diagram for Week 5 only. Later this week I will publish the Cumulative Index - when I do I'll pop that link here.

Observations:

There were two games this past weekend with lopsided scores (3-nil LA over Chivas) and (4-1 FC Dallas over Houston).

Up until the completion of the LA Galaxy 3-nil thrashing of Chivas USA, it looked like FC Dallas would be top of the heap for Week 5 - and rightly so given they put 3 past Houston plus they got the Orange team to give them an own goal as well.

But as you can see, LA were tops this week; more later on why, and it may surprise you.

The tough part about the FC Dallas game, for Houston, was the straight red and sending off of David Horst on what the Referee considered was a rash foul down Houston's right sideline. I'm not so sure about that but as we have seen so far this year, the Referee's are stamping their authority with no reservation whatsoever.

Spilt milk and, as it goes. Dallas scored three goals within 15 minutes of that Red Card to take three points. If you run a team defense in Fantasy football and have Houston in that role you got hosed - I do and I got hosed in the back-four; still got 52 points though!

But back to the LA Galaxy match on Sunday

If anyone wasn't sure about how Landon Donovan could operate in a Diamond 4-4-2, be advised that he can - he has - and he will; when surrounded by other strong players, he's tough to stop.

For me, though, this game wasn't about just scoring goals. It was also about defense, and it's that defensive mindset that put LA at the overall top this week - clean sheets matter!

As for the bottom side of the Index...

If it's LA shutting down Chivas that garners the top offensive spot, then it's reasonable the flip side is the complete lack of structure and focus from Chivas that sees them at the bottom.

Carlos Bocanegra has great mental awareness, but he can't stop an aggressive Galaxy attack on his own - and in the short glimpses I had of their video it certainly looked to me like Baptiste and others were simply outmatched.

As for Houston - enuf said - the Red Card to Horst directly influenced the outcome of that game.

As for the middle of the middle of the pack... if you read my recommendations above about the Timbers-Sounders match, you know that game was all about possession with the intent to penetrate. There was absolutely no possession, that I saw, where the intent was to possess just for the sake of controlling possession.

There is no love lost between those two teams, and it seems every time they meet both just simply want to smash each other senseless. It makes for great entertainment, but there are times in my book where negative football has value, and securing three points (like it or not) is a time where negative football has value.

So on to the PWP Attacking Index; here's how they lined up head to head...

PWP STRATEGIC ATTACKING INDEX WEEK 5 ONLY

Observations:

For the first time this year the magical 3.00 barrier was broken in the attacking index. It comes on the heels of the USMNT also breaking the 3.00 barrier in the first half against Mexico. If you missed my thoughts on that game, you can review them here.

Onwards and upwards - for the first time this year Portland broke the top-five barrier in team attack for a given week, getting two stunners from Diego Chara plus another couple from the Argentina contingent of Diego Valeri and Maxi Urruti.

Not to be outdone was the final 20-minute performance of Clint Dempsey - aye - he got a goal early on, but for much of the game his influence and presence was pretty much unnoticed. Indeed, the chalkboard tells us that between about the 40-minute mark and the 70-minute mark, he had just 9 touches of any sort with no shots or key passes. It wasn't until the 70-minute mark where he started to directly influence and impact the game. After that point, Dempsey had no fewer than 18 touches in the run of play with one key pass, three shots on target, and a goal.

I'm all for highlighting his hat trick in that game, but he simply wasn't solid through the full 90+ minutes, and his team barely eked out a draw.

Understanding that and seeing the red-card tainted blowout of Houston by FC Dallas my PWP Attacking Player of Week 5 was...

Observations:

That may be a surprise to some on two fronts. One - Dempsey got a Hat Trick. And Two - what about Watson or Diaz?

Well, as already noted, Dempsey simply didn't play well for a full 90+ minutes and his presence and influence did not prevent Portland from having their best attacking performance of the year.

In addition, it's likely Seattle drops three points if Ben Zemanski doesn't do what he did in the box, and I'm simply not in favor of seeing someone getting an Attacking Player of the Week award when his team loses or draws. 3 points is the objective in this game - it's not all about just scoring goals.

And two - while Diaz is the spark that lights the Dallas attack this year and Watson donated a brace of goals this weekend, I feel and think Michel had more overall responsibility on the pitch; therefore - given his vast number of touches on both sides of the ball I give him the award.

And in case you missed it, I don't view this weekly award as going to someone who just lights up the front end without also considering how well they supported the back end.

Time now for Defending PWP Team of the week, where the LA Galaxy really made it count

Observations:

It was a close call between LA and Sporting KC this week when it came down to it; any team who can get a clean sheet against Real Salt Lake has really done their job.

But... alas... the Top PWP Defending team was LA. Why? Well it really came down to how poorly Chivas USA performed against LA, and not how poorly Real Salt Lake performed against Sporting; remember - this Weekly Index does not get influenced by previous performances on a week to week basis only the Cumulative Index does.

When checking out my Cumulative Index later this week, you may see a change in who the top defending team is overall - for now though - this is just Week 5.

In looking at the player statistics I had considered awarding the PWP Defender of Week 5 to Landon Donovan, and here's why: he had three key passes, five recoveries and an 85% passing accuracy with 2 assists. But the more compelling case fell to Juninho, given his combined efforts (like Michel) playing on both sides of the ball.

Here's the Diagram offering up his team effort on Sunday...

In closing

Week 5 saw some individual players step up and some team performances improve as compared to previous weeks. It's a long season, and it's likely the Cumulative Index will continue to take shape - especially after the (unexpected) Toronto victory over Columbus in Ohio.

You may have thought that game flew under the radar, but it hasn't, and Toronto will look the better for it in my Cumulative Index... all is not lost when a team gets a big victory without getting the headlines for that week.

If curious - here's a link to my Weekly PWP analysis on the Red Bulls of New York.

All for now,

Chris

Possession with Purpose: an introduction and some explanations

Please welcome to our little team of analysists and helpers Chris Gluck, whose PWP is going to be added to the metrics table this year---a solid instrument in telling us how teams have performed in turning possession into goals. Currently it's one of the best open-source metrics out there to tell us such things. I hope you'll enjoy his contributions as much I will - Harrison First things first --- my thanks to Harrison Crow and Matthias Kullowatz for the opportunity to post my Possession with Purpose Introduction on American Soccer Analysis.

If you’ve been following me this past year through Columbian Newspaper--out of southern Washington--you’ll know that I’ve been researching statistics in Major League Soccer. My intent has been to develop a simplified (Strategic) set of team performance indicators that may help others better understand soccer and how the outcome of a game may be better understood based on the primary inputs to the game.

Data for my research comes from documenting and analyzing all 646 MLS Regular Season games in 2013; the source data originates with OPTA and is displayed on the MLS Chalkboard and the MLS Statistics Sheet found through www.mlssoccer.com.

With that here’s my introduction on Possession with Purpose…

To first understand the context, I offer that this is one of the End States of my effort: create a simplified approach and documented method for measuring team performance where the output is an Index that (while excluding points) comes close to matching results in the MLS League Table.

Beginning with that End State in mind here is the End State product:

pic1

Observations from the Diagram…

Note that 9 of the top 10 teams in this Index made the MLS Playoffs last year with the Houston Dynamo finishing 12th in the Index.

For comparison, in benchmarking whoscored.com their Index only had 8 of their top 10 teams make the Playoffs, while www.squawka .com matched my 90% success rating, but the team they missed in the top 10 (New England) finished 16th in their Index.

From a strategic standpoint, the End State objective has been met; create a simplified approach and documented method for measuring team performance where the output is an Index that (while excluding points) comes close to matching results in the MLS League Table.

Defining the PWP Attacking and Defending Processes…

Here are the six steps in the PWP Strategic Attacking Process:

  1. Gain possession of the ball,
  2. Retain possession and move the ball,
  3. Penetrate & create goal scoring opportunities,
  4. Take shots when provided goal scoring opportunities,
  5. Put those shots taken on goal,
  6. Score the goal.

Here are the six steps in the PWP Strategic Defending Process:

  1. Minimize opponent gaining possession of the ball,
  2. Minimize opponent retaining possession and moving the ball,
  3. Minimize opponent penetrating and creating goal scoring opportunities,
  4. Minimize opponent taking shots when provided goal scoring opportunities,
  5. Minimize opponent putting those shots on goal,
  6. Minimize opponent scoring the goal.

Every step is this process has an average success rate (percentage) based upon data gathered from all 646 MLS Regular Season games.

Understanding the context of these steps versus other conditions and activities that influence the outcome of a game…

In case you missed it I call these Processes and the Indices “Strategic” to separate their value/meaning relative to other things that can influence the outcome of a game.

For me I have two other ways to classify information that can influence the outcomes in those steps. I have Operational conditions and Tactical metrics; provided below are some examples of each:

  • Operational conditions: Scheme of maneuver a team uses in setting up their system, such as flat-back four, flat-back three, double-pivot midfield, single-pivot midfield, bunkering with counterattacking, pressing high, direct attacking, possession-oriented attacking, weather conditions, location of the game (home/away), conference foe, non-conference foe, etc…
  • Tactical metrics: Locations of shots taken, shots on goal, and goals scored; penalty kicks, free kicks, crosses, headers won/lost, tackles won/lost, interceptions, clearances, blocked crosses, blocked shots, etc.

The diagram below shows the PWP Strategic Attacking Process with the average percentage of success rate in MLS for 2013. A more detailed explanation of each step is provided below the diagram.

pic2

Step 1: Gain possession of the ball: The intent behind this basic step should be clear; you can’t win the game if you don’t possess the ball to some extent. A second consideration about this step is that the more you possess the ball the less your opponent possesses the ball.

  • From a defensive standpoint there are any number of ways a team can work to gain possession of the ball; they include, but are not limited to, tackling, intercepting, clearing the ball, winning fifty-fifty duels on the ground or in the air, or simply gathering a loose ball based upon a deflection or bad pass.
  • For this Process the measurement of success is the percentage of possession a team has in a given game; note that in Soccer, the primary method for measuring possession is to add up the number of passes made in a game and divide into that the amount of passes one team makes (create a ratio percentage of possession); the opposing team has the difference between 100% and the percentage of possession that the other team has.
  • It’s not perfect but it provides a simplified ratio to compare one team versus another…

Step 2: Retain possession and move the ball: It shouldn’t be a secret to many that in most cases the team possessing the ball will need to move the ball in order to penetrate the opponents Defending Third and score a goal.

  • This is not to say a team has a minimum number of passes they need to complete to score a goal; for teams winning possession deep in the opponents Defending Third there may be times where the only thing needed is a quick shot on goal.
  • By and large, however, most teams – when they gain possession of the ball – do so in their own Defending Third and then move the ball (eventually forward) in a position where a teammate can create a goal scoring opportunity for another team member to take a shot.
  • For this process, the measurement of success is the team's passing accuracy percentage across the entire pitch; passes completed divided into passes attempted.
  • It’s not perfect, but it provides a simplified ratio to compare one team versus another; statistically speaking there are weaknesses in how this percentage is measured by the big data folks.
    • Throw-ins, for example, move the ball across the pitch from one player to another yet they are not officially counted as passes.
    • Successful crosses are also not counted as a successful pass even though the ball moves successfully from one player to another.
    • Oddly enough, when evaluating the data provided on the MLS chalkboard, an Unsuccessful cross is included as a Pass attempted (?!)
    • For the purposes of this analysis I had to count all successful crosses as successful passes; therefore my final pass completions totals will be slightly higher than what Opta provides. It is what it is…
  • I should also point out here that there are occasions when a team wins possession of the ball and takes a shot where no pass was completed. Like I said, this measurement method is not perfect but it is ‘equal’ in ignoring that exception for all teams.
  • Therefore the measurement itself has value in tracking the majority (bell curve) of activities that normally occur in a game of soccer. And as a reminder, these are Strategic steps in PWP; by definition a Strategic step will not measure to a level of granularity; that is where Tactical metrics come into play based upon an Operational condition where the team is applying pressure higher up the pitch.

Step 3: Penetrate and create goal scoring opportunities: Most know that a pitch is divided into three parts; the Defending Third, Middle Third, and Attacking Third. For the purposes of this effort, Penetration is associated with entering the opponent’s Defending Third with the intent to score.

  • For this Process, penetration is measured by dividing the volume of passes a team completes within the opponent’s Defending Third into the volume of passes a team completes across the entire pitch.
  • It’s not perfect but it creates a ratio that treats all teams fairly, and given the overall accuracy of the End State Index (90%), it’s a reasonable way to measure this step.
  • In order to measure this step I first had to manually filter, for all 646 games, every pass attempted and completed using the MLS Chalkboard; my thanks to MLS and OPTA for providing us ‘stats’ guys the opportunity to do that. With Golazo stats now available, that task will be easier next year. As a stats guy, it would have been inappropriate to switch measurement methods ¾’s of the way through the year.

Step 4: Take shots when provided goal scoring opportunities: This is, by far, the hardest indicator to measure, given how current data sites really lack granularity in how they identify/define ‘created goal scoring opportunities.'

  • I define a ‘created goal scoring opportunity’ as any pass, successful or not, that may have ended with another teammate taking a shot. That’s hard to quantify, but an example, if you will:
    • A fullback overlapping down the right side puts in a wicked cross that gets cleared at the last minute by a center-back, with his head. With OPTA and other data companies that wicked cross, though unsuccessful, is not quantified as a goal scoring opportunity created; it’s merely tracked as a clearance and an unsuccessful pass.
    • I disagree; the fullback did their job in putting in that wicked cross – what really happened is the defender also did their job in clearing it – therefore a “potential” for the attacking team to complete a created goal scoring opportuinty and take a shot was denied.
    • Both the attacking team and defending team should be statistically credited for doing what they are expected to do. Others may disagree…
    • But as a Head Coach, I would put to memory that the fullback did what was supposed to happen; create the chance – therefore in my books that player created a goal scoring opportunity.
  • For this Process, the step is measured by counting the number of Shots Taken compared to the number of completed passes in the opponent’s Defending Third.
  • It’s not perfect, but it’s measured in an unbiased manner for every team, and there will be instances where a shot can be taken without a completed pass or originate from a defensive error.
  • In going back to the example, as a Head Coach I would call that effort a “failed assist.” I think there is value in knowing the number of “failed assists” as much as there is in knowing “assists.”
  • By tracking “failed assists” it provides a pure, statistical way, to track individual player performance (tactical metric) that can influence team performance.
  • Bottom line on this one, as contentious as it may be for some, recall the End State of this Final Index… create a simplified approach and documented method for measuring team performance where the output is an Index that (while excluding points) comes close to matching results in the MLS League Table.
  • Given the accuracy rating of 90% in matching the top 10 Playoff teams this year I feel and think the approach to measure this indicator works.
  • If OPTA, or another data compilation agency starts to track “failed assists”, could an Index like this reach 100% accuracy?

Step 5: Put those Shots Taken on Goal: For the most part this is an individual statistic that is added up to create a team performance indicator.

  • For this process, the step is measured by dividing the number of Shots on Goal by the number of Shots Taken.
  • It’s one of the easier indicators to measure, and if you watch any level of soccer, it's pretty self explanatory – if the Shot can come anywhere within the dimensions of the Goal, it is considered a Shot on Goal. One of two things happens; it goes in or it doesn’t.

Step 6: Score the Goal: One critical objective of the game.

  • I say ‘one’ because indications, I see, lead me to offer that this game is not all about scoring goals.
  • In my research it appears to me that teams who defend better seem to take more points in games than teams that don’t defend very well.
  • A recent example in my End of Season analysis of Vancouver: in Western Conference competition, they scored 35 goals and gave up 35 goals; all told they took just 26 of 72 possible points – clearly, in this example, scoring goals did not result in wins…
  • Prozone, a noted professional sporting analysis company, offers the following in the article: “Using data from the last ten seasons of the Premier League, Anderson and Sally compared the value of a goal scored and the value of a goal conceded. They found that scoring a goal, on average, is worth slightly more than one point, whereas not conceding produces, on average, 2.5 points per match. Goals that don’t happen are more valuable than goals that do happen.”

In closing…

  • It’s not perfect, but it provides reasonable information in a reasonable format that has reasonable value when comparing the End State output to how the MLS League Table finished.
  • For those interested the PWP Strategic Attacking Index and Defending Index are provided below:

pic3

PWP STRATEGIC DEFENDING INDEX END OF 2013

  • In looking at these two Indices, note the number on the left; the difference between the Index number in the Attacking Index and the Defending Index is the number that appears to the left in the Final Strategic Index at the beginning of this article.
  • That may help explain why some teams finished above zero, as opposed to below zero in the Final Index.
  • Teams finishing above zero had team attacking percentages that exceeded their team defending percentages; in other words they were better in their attack against the opponents than the opponent’s were in attacking them.
  • Team success rates in these six steps will be used next year to begin to analyze how well the team is performing as the new season starts compared to performance the previous year.

Follow Chris on twitter at https://twitter.com/ChrisGluckPTFC, and keep up with his PWP metric all season!