Pressing, Defensive Lines, and What Defensive Actions Correlate with Goals

Pressing, Defensive Lines, and What Defensive Actions Correlate with Goals

How do you analytically measure a high defensive line and defensive pressing (see StatsBomb pressing index and Jamon's piece from a couple weeks ago)? Do we have enough data and information to analyze this behavior? If we do, how do these tactics impact the performance of a team?

Read More

The Elusive Advanced Defensive Metric

The Elusive Advanced Defensive Metric

It all started with Micheal Azira.

At the conclusion of the 2017 MLS season, I sifted through the wreckage of the Colorado Rapids awful season, player by player, to see what could be learned. Who, among these players was actually a high-quality soccer player? Who should the team retain for next year? Who should be jettisoned? Why? How can I know the difference? And, most importantly for readers of a data-obsessive website like American Soccer Analysis, can I find a credible way of answering those questions using advanced metrics?

Read More

Mapping Defensive Actions: A Spatial Analysis of Where Teams Focus Their Efforts

Mapping Defensive Actions: A Spatial Analysis of Where Teams Focus Their Efforts

Every team has its own “style”. Some teams bunker, some teams high-press, some clog the middle, some work the wings. Where they defend is a major part of what defines their style. The recipe for a team’s defensive shape is one part tactics and 11 parts players on the field. Certain players seem to naturally gravitate their efforts to particular areas, be it the wing they’re assigned to, their preferred foot, their favorite partner-in-crime or how they’re instructed to approach the opposition. In the end, the action happens in consistent general areas of the field, but in complex patterns.

One could take an Opta map from any particular game and examine the defensive spatial patterns. You can see the clusters of defensive actions as well as voids where a team hardly seems to find themselves defending at all. But that’s just one game. We all know that teams are forced to adapt their style of play to their opposition, and whatever flukey circumstances played out in that game might not be totally indicative of a team’s overall style. What would really be telling is the aggregate over multiple games.

Read More

ASA First Touch: Colorado's waste of resources

Finally, the Secretary of Defense is home. Though the game ended in the dreaded 0-0 tie, Tim Howard’s debut with the Rapids was surely the biggest storyline of the week. When his signing was originally announced, there was no doubt he would take over immediately as the starter, but it did create a tremor of controversy.  Are the Rapids really best served by changing their goalkeeper after letting in the fewest goals of any team after 16 games?

Read More

"Hurried Passes" - Could this be a new Statistic in Soccer?

Aye... the NFL track 'hurried throws' -  why doesn't a Statistics agency involved in Soccer track "Hurried Passes"? I'll get to that but first I need to set some conditions.

If you've read my article on Expected Wins  (XpW) it seems reasonable that a teams' Passing Accuracy in the Final Third has great value in working towards generating quality shots taken that are more likely to be on goal and (therefore) more likely to go in.

So what activities does the defense take to mitigate successful passes (i.e. generate Unsuccessful Passes)?

Before digging in, I'm not the only one on American Soccer Analysis looking into Defensive Statistics; Jared Young has put together an interesting article on Individual Defensive Statistics that may be of interest.

Similarities in our work come from collecting 'like' defensive activities; Tackles Won, Clearances, Interceptions, etc...

Additional twists in my efforts will be to fold my Opponent team attacking statistics in with my team Defense Activities to see what correlations might be present.

My data comes from the first 71 games in MLS this year (142 events) and my source is the MLS Chalkboard.

Bottom line up front (BLUF) - however this data plays out it needs to make sense so here's my operating conditions on Team Defensive Activities in the Defending Final Third and which ones I will focus on that can be associated with an Unsuccessful Pass in the Final Third:

  1. Recoveries - usually associated with 'loose balls' generated from some other activity like a deflection, rebound, or perhaps an unsuccessful throw-in that hits a head and deflects away (uncontrolled) that another player latches on to and then makes a move showing control the ball.  Therefore Recoveries are not counted as a specific defensive activity that would impede a successful pass - it is the resultant of another activity that impedes a successful pass.
  2. Clearances - one of the better examples of a defensive activity that impedes a successful pass - especially those generated from crosses but not necessarily called a blocked cross.  Therefore Clearances will be counted as a specific defensive activity that impedes a successful pass.
  3. Interceptions - pretty much self explanatory - an interception impedes a successful pass - therefore Interceptions will be counted as a specific defensive activity that impedes a successful pass.
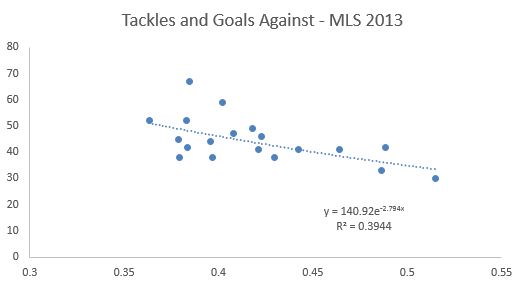
  4. Tackles Won - this is a defensive activity that strips the ball from an opponent - so it is a possession lost but not a defensive activity that impedes a successful pass.  It won't be counted as a defensive activity that impedes a successful pass.
  5. Defender Blocks - this is a defensive activity that blocks a shot taken not a successful pass; therefore it won't be counted as a defensive activity that impedes a successful pass.
  6. Blocked Crosess - clearly it is what it is; and since a cross is a pass it will be counted as a defensive activity that impedes a successful pass.

To summarize - Blocked Crosses, Interceptions and Clearances will be counted as defensive activities that should impact the volume of Unsuccessful Passes.

So what are the correlations between those combined Defensive Activities versus Unsuccessful Passes after 142 events?

Final Third Defensive Activities to Unsuccessful Passes = .6864

Final Third Defensive Activities to Unsuccessful Passes when the Defending Activities' Team Wins = .7833

Final Third Defensive Activities to Unsuccessful Passes when the Defending Activities' Team Draws = .6005

Final Third Defensive Activities to Unsuccessful Passes when the Defending Activities' Team Loses = .6378

In conclusion:

It seems pretty clear that Teams who win have more Defensive Activities, that in turn increase their Opponents' Unsuccessful Passes given the higher positive correlation than losing teams - in other words a team that wins generally executes more clearances, interceptions and blocked crosses to decrease the number of Successful Passes their Opponents make.

It also seems pretty clear that all those Defensive Activities don't account for the total of Unsuccessful Passes generated by the Opponent.  If they did then the correlation would be higher than .7833; it'd be near .9898 or so.

So what is missing from the generic soccer statistical community to account for the void in Unsuccessful Passes?

Is it another statistic like Tackles Won, Duals Won, Blocked Shots or Recoveries?

I don't think so - none of them generated a marked increase in the overall correlation of those three Activities already identified.

I think it is the physical and spatial pressure applied by the defenders as they work man to man and zone defending efforts.

In Closing...

To date I'm not aware of any statistics that log 'pressure applied' to the attacking team.  A good way to count that would be tracking how many seconds the defending team gives an opponent when they recieve the ball and take action.

My expectation is that the less time, given the opponent, the more likely they will hurry a pass that simply goes awry without any other statistic event to account for that other than - bad pass due to being hurried.

So in other words; like the NFL tracks hurried passes, I think that the Soccer statistical community should also track "hurried passes"...

I'm not sure that completely closes the gap between those three Defensive Activities and Unsuccessful Passes but it does seem to be a relevant statistic that can attempt to quantify panic in an attacker while also quantifying good physical and spatial pressure by a defender.  Two relevant items of interest to a coach in weighing the balance on who plays and who doesn't and who they might like to add to their team or perhaps put on loan/trade elsewhere.

The Official statistic that would get tracked for attacking players is 'Hurried Passes' and the statistic that would get tracked for defensive players is 'Passes Hurried'.

In addition - an increase in hurried passes can become a training topic that drives a Head Coach to develop tailor made passing or turning drills to minimize Hurried Passes (make space) while also providing a Head Coach statistical information to generate tailor made defensive drills that look to increase Passes Hurried.  I'd expect the level of the training drills to vary given the level of skill/professional development as well.

So how might someone define a "Hurried Pass"?  I'm not sure; there are plenty of smarter people out there in the soccer community than me - if I had to offer up a few suggestions it might be a pass that goes out of bounds given defensive pressure, or maybe a through-ball that goes amiss given pressure from a defender - in other words the timing of the delivery looked bad and given defensive pressure it was off-target.

However defined if judgment can be applied when identifying a pass as a key pass then it stands to reason that judgment can be applied to identify a bad pass as being bad because the defender hurried the attacker.

More to follow...

Best, Chris


Individual Defensive Statistics: Which Ones Matter and Top 10 MLS Defenders

When a car breaks down, a mechanic's job is to tell you what caused the failure. He or she can generally pinpoint the problem to a specific part reaching the end of its useful life. But have you ever asked a mechanic why your car is working fine? Or which part deserves the most credit for your car running smoothly? Of course not. That would be a waste of everyone's time. There are many parts to a car and all are doing their job as designed. We never ask why when things are going well. The same dilemma exists in assessing soccer defenders. After all, most of how we assess defenders has to do with what goals were not scored. And when all the parts of the defenses are working as designed, goals are avoided. But which defenders deserve the credit when goals aren't scored? It's like the pointless car question, which parts of the car deserve the most credit when the car runs smoothly?

To even begin this conversation we need to take stock of what data exists for soccer defenders. And just to be clear, I am going to steer clear looking at a defender's offensive capability. I want to focus solely on defensive statistics. Whoscored is the only site that offers a collection of defensive statistics, and here is what they have and their definitions.

  • Blocked Shot: Prevention by an outfield player of an opponents shot reaching the goal
  • Clearance: Action by a defending player that temporarily removes the attacking threat on their goal/that effectively alleviates pressure on their goal
  • Interception: Preventing an opponent's pass from reaching their teammates
  • Offside Won: The last man to step up to catch an opponent in an offside position
  • Tackle: Dispossessing an opponent, whether the tackling player comes away with the ball or not

These are the defensive-oriented statistics offered by Whoscored that are tracked at the individual player level. Of course, the other vital defensive statistic is shots conceded but those can't be attributed to any one player. So then, do any of these statistics matter? First there are a couple of assumptions to iron out.

A defender should be judged by the rate at which he accumulates statistics. So to get to that number we need to adjust these statistics to account for the time that the opponent has the ball. For example, Player A who averages 5 clearances per game might be better than Player B who averages 6 clearances if Player A's opposition had the ball 20% less often. That would mean player A made more clearances given the opportunities provided to him. So I will adjust all metrics by opposition possession.

Since I am trying to assess what goals are not scored, I going to look at the numbers at the team level first. It is only at the team level that goals can be attributed. After that analysis I will attempt to attribute value to the individual metrics.

sources: whoscored, mlssoccer.com

Here are tackles per game per minute of opponent possession against goals scored. Tackles represents the strongest correlation of all the variables. In fact, tackles has a slightly stronger correlation to goals against than shots conceded. Here is a look at the shots conceded as a percent of opponent minute of possession.

sources: whoscored.com, mlssoccer.com

The two points to the far left represent the LA Galaxy and Sporting Kansas City. They appear adept at limiting shots on goal per minute of opposition possession. They also stand out when looking at offsides won.

Rather than show every graph, here is a table of the defensive statistics, their level of impact and the R squared of the impact in predicting goals against.

Statistic

Goals Avoided per Unit

R squared

Clearances

-0.041

27.1%

Interceptions

-0.036

15.1%

Tackles

-0.077

39.4%

Offsides Won

-0.113

16.0%

Blocks % of Shots

-0.017

0.3%

Offsides won is the most impactful of the statistics (has the greatest slope) but there is a weaker correlation than Tackles or Clearances--in other words, there are greater deviations from the trend line. It's interesting to see that Blocks as a percent of shots has almost no impact on goals allowed.

This is interesting, but what to make of it all? In an ideal world we could compile these statistics into a meaningful metric in order to compare players. The most obvious way to do that statistically would be to run a multivariate regression using all of the statistics.  The trouble with the result is that the statistics end up not being statistically significant predictors when mashed together. So developing a score from these metrics would be a bit of a fool's errand.

The other option would be to ignore the predictive strength of the variables and just use the goals avoided results as a scalar, multiply them by each player's statistics, add them up and compile a score. In this case the resulting score would be something we relate to as we could say that this player avoids x number of goals per game. However, this would give offsides won the statistic with the greatest importance despite the fact that the correlation is not strong.

To factor in the correlation we could leave the realm of sound statistical practice. We could multiply the goals avoided scalar by the R square. We could turn that into an index with the highest metric (tackles) equaling 1. If we did that here is the resulting table and values for each metric.

Statistic

Goals Avoided per Unit

R squared

GApU x R2

Index

Clearances

-0.041

27.1%

-0.011

0.37

Interceptions

-0.036

15.1%

-0.005

0.18

Tackles

-0.077

39.4%

-0.030

1.00

Offsides Won

-0.113

16.0%

-0.018

0.60

Blocks % of Shots

-0.017

0.3%

0.000

0.00

Tackles would be the most important statistic followed by offsides won and then clearances and interceptions. It turns out blocked shots have no material value in estimating goals against.

Before I use these numbers to reveal the top 10 MLS defenders, here are the caveats. Obviously this ranking is missing a few vital elements of defending in soccer. The first major omission is positioning. Often a defender being in the right position forces an offense to not make a pass that would increase their chance of scoring. There is no measurement for that but obviously a defender out of position is not a valuable defender. Clearances, interceptions, tackles and offsides won are clearing indicators that the player was probably in position to make the play and they indicate the player succeeding making the necessary play. But offensive attempts avoided are clearly missing.

The other major omission is the offensive play of the defender. A defender who defends well and represents an offensive threat is that much more valuable. But I'm not trying to solve for that here. I leave that for the subject of another post to integrate passing and offensive numbers to build a better score for defenders.

Here are the top 10 MLS defenders based on the score developed through the last week for players with a minimum of four appearances.

Rank

Name

Team

Tackles

Intercepts

Off Won

Clears

Defender Score

1

José Gonçalves

New England Rev.

1.6

2.4

2

11.2

7.376

2

Giancarlo Gonzalez

Columbus Crew

2.1

2.9

1.9

9.3

7.203

3

Norberto Paparatto

Portland Timbers

1.8

4.8

1.3

9.3

6.885

4

Carlos Bocanegra

CD Chivas USA

1.5

3.6

2.1

8.9

6.701

5

Andrew Farrell

New England Rev.

2.9

2.4

0.3

8.3

6.583

6

Jamison Olave

New York Red Bulls

1.9

3.1

1.7

6.7

5.957

7

Victor Bernardez

San Jose Quakes

1.5

2.8

0.7

9.5

5.939

8

Matt Hedges

FC Dallas

1.5

3.9

0.9

8.5

5.887

9

Eric Avila

CD Chivas USA

4

2.4

0.8

2.3

5.763

10

Chris Schuler

Real Salt Lake

1.8

2.8

0.5

8.3

5.675

I find it comforting that, for a new metric, Jose' Goncalves, MLS Defender of the Year in 2013, tops the list. There's a big drop between the top 2 defenders and Paparatto. There's also another cliff after Andrew Farrell. But hey, it's a start.

I hope this was an enlightening ride through the mechanics of defending from a soccer perspective. The next time you're watching a game, don't just focus on the breakdowns. Also look for what makes the defense successful.